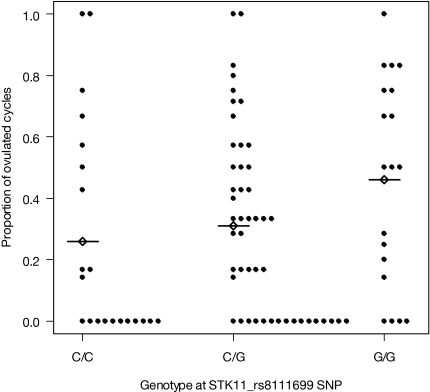
Figure 2.
Proportion of ovulated cycles for patients in the metformin group (each dot represents a subject) by genotype at STK11_rs8111699. The mean (sd, no.) proportion of ovulated cycles is 0.26 (0.35, 21), 0.31 (0.30, 48), and 0.46 (0.34, 19) for C/C, C/G, and G/G groups, respectively. Mean proportion is indicated by a diamond with line.

