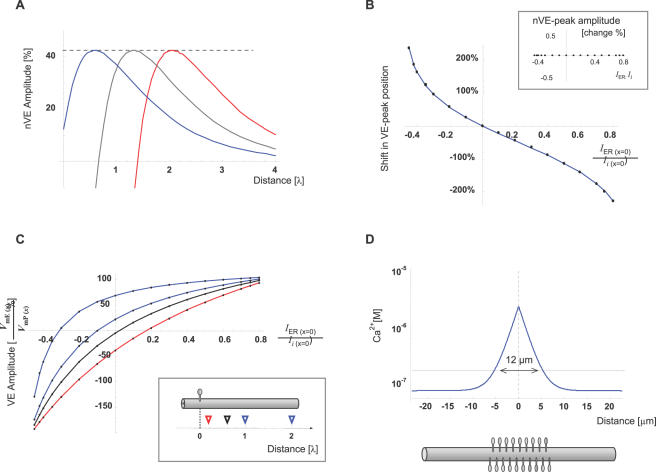
Figure 3. The individual synapse can determine the VE position or its polarity at a distinct target along the cable.
(A) Synaptic input initiates, simultaneously, axial currents along the cytosol (Ii) and along the ER lumen (IER). The ratio (I) between these currents at the synapse (IER (x = 0) and Ii (x = 0), respectively), modulates the position of the VE. These currents may be modified by active transition of charges (i mER; Eq. G1.4, G1.5) across the ER membrane, at the synapse, during synaptic activation (see text for details). The traces represent steady-state nVE introduced by 3 different synaptic signals with identical V mP(x = 0) (i.e. potential across plasma membrane at the synapse), identical cable properties, but different I ratios (blue, red and black traces represent simulations of synaptic activation with positive, negative and zero I, respectively). (B) VE-peak position is presented as a function of I. Its position is represented as percent of the distance between the synapse and VE-peak when I = 0. Inset: The amplitude of nVE-peak as a function of I. Y-axis describes the percent change in the peak level of nVE, from the default (I = 0) level. (C) The effect of I on V mE at several fixed distances from the synapse. Each trace represents the nVE level as a function of I at a fixed position (0.2, 0.6, 1, 2 space constants from the synapse; red, black blue and blue, respectively). V mE amplitude at each position is described as percent of V mP amplitude (EPSP) at that specific distance from the synapse. Inset: Triangles depict the sampling position of traces with corresponding color. Note that at each target, VE amplitude can reach 100% of EPSP level or drop below zero. (D) Steady-state calcium level is plotted as function of distance from a point source of calcium (1 pA). The calculations assumed basal Ca2+ level of 70 nM and an endogenous mobile buffer of kD = 50 µM and concentration of 0.5 mM (see text for details). The region with a significant calcium elevation was assumed to be where Ca2+ level raised above twice the basal level (dashed line; 12 µm). With a typical dendritic spine density [35],[36] the estimated extent of Ca-signal spread along the dendritic shaft, is predicted to cover a region occupied by ∼20 dendritic spines.

