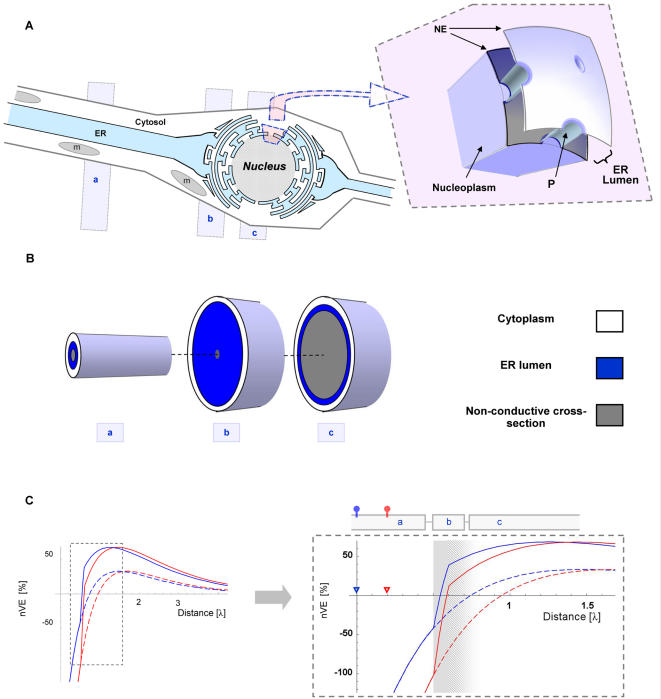
Figure 4. The transition from dendrite to soma compels the VE to converge at the soma.
(A) The soma is characterized by a wider diameter and the presence of the cell nucleus. The nucleus is enclosed by two nuclear envelopes (NE) and occupies the majority of the cell's cross-section, at its widest diameter. The outer NE is continuous with the ER membrane and the space between the two NE is continuous with the ER lumen (ER lumen). The NE allows continuity between the nucleoplasm and the cytosol through pore complexes (P), ∼9 nm in diameter. Altogether, the structure of the nucleoplasm and the two nuclear envelopes establishes an electrical continuity with the inner cable. Thus, the electrotonic pathway from the dendritic spine to the cell nucleus may be reduced to three successive CIC systems as indicated by three grey rectangles: (a) dendritic-CIC, (b) perinuclear-CIC and (c) nuclear-CIC. (B) A simplified simulation of the transition from dendrites to soma was conducted by connecting a dendritic-CIC (labeled ‘a’) with somatic-CIC (labeled ‘b’ and ’c’). The dendritic-CIC followed the default parameters (Table 2), whereas the somatic-CIC had a wider diameter (d mP = 16 µm) and was further divided into two consecutive segments: perinuclear zone (labeled ‘b’) and nuclear zone (labeled ‘c’). The perinuclear-zone was short (0.2 λ) and characterized by a narrow cytosolic cross-section and wide ER cross-section (E = 0.99) and the nuclear-zone was characterized by a wide non-conductive cross-section (N = 0.9 and the original E value, E = 0.45). (C) V mE traces of two spatially distinct synaptic sources (red and blue traces) separated by a distance of 0.2 electrotonic units, are plotted with and without the effect of the somatic-CIC (solid and dashed lines, respectively). Each trace is scaled to the EPSP amplitude at the VE-peak (nVE). Right: Vertical expansion into the region of transition from dendritic-CIC to somatic-CIC (shaded zone). The triangles mark the origin (i.e. synaptic source) of each curve by corresponding colors. Note that at the segment that follows the transition from a dendritic-CIC into a somatic-CIC, both traces, which are otherwise negative, become positive and the VE peaks reach higher levels.

