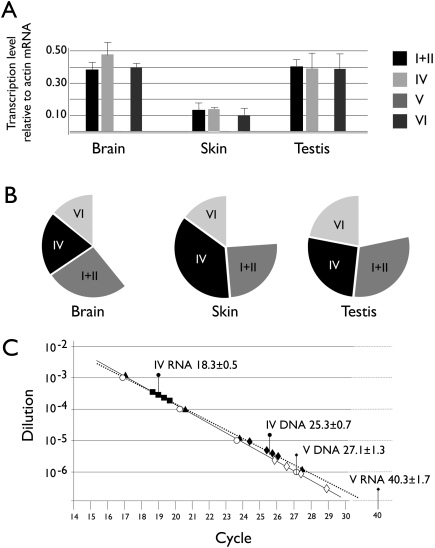
Figure 7. Quantitative analysis of v-rDNA expression.
A, RNA samples from two hbyrids (C57BL/129Sv) were assayed with qPCR, the expression level was normalized with the transcript of beta-actin. (n = 2). Note that because V was not detected, only three bars are visible. B, In another experiment, the v-rDNA expression level was normalized with the 47S pre-rRNA (represented by the full circle) to show the contribution of each v-rDNA to the pre-rRNA pool. The values are average of two measurements. The blank sector is the portion of pre-rRNA not accounted for by the v-rDNA transcripts. C, A comparison of RNA and DNA quantity ratios. Ct values of RNA and DNA are superimposed on the standard curves of the two qPCRs for v-rDNA IV and V. Ct values of serial dilutions of cloned DNA (IV, black triangles; and V, open circles) are shown with the standard curve. RNA (transcript) Ct values are shown by squares (IV, black). The value of v-rDNA V is out of range, thus not plotted, but the average and standard deviation are indicated. Genomic DNA measurements are depicted as diamonds (IV, black and V, open). The average and standard deviation of 2 samples, each measured twice, are indicated by pins; circle-ended pins for variant IV and diamond-ended ones, V.

