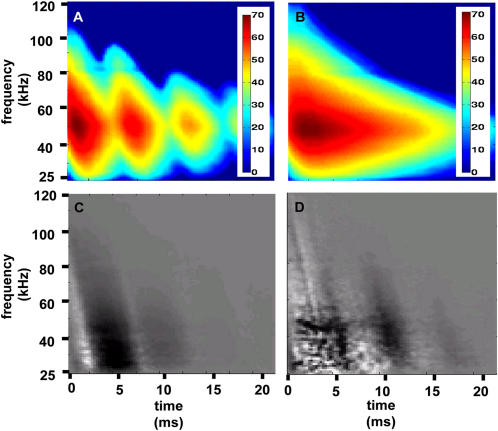
Figure 2. Decision echo analysis for the classification task: corn vs. the rest.
(A) Average spectrogram of the raw data of corn. The color bars for both (A) and (B) are in dB. (B) Average spectrogram of the raw data of all the plants except corn (i.e. the rest). (C) The difference of the preprocessed spectrograms of spruce and the rest. (D) The normal vector (decision echo) to the separating hyperplane calculated for this classification task. In both (C) and (D) black represents negative values, white represents positive ones, and gray is zero.

