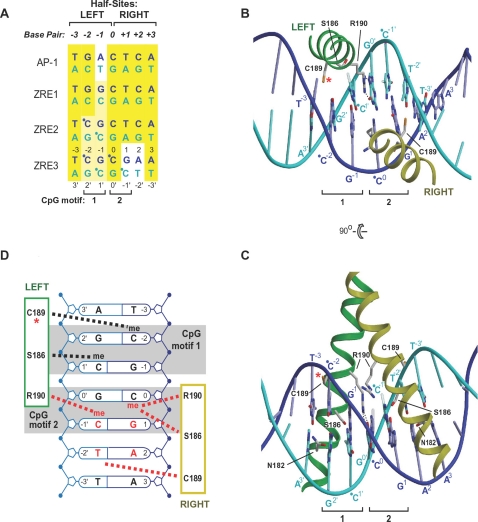
Figure 6. Structural model of Zta bound to meZRE3.
A. Alignment of Zta recognition sequences. The numbering convention is shown for base pair positions (bold italics) and individual nucleotides (plain font). Cytosines modified by methylation are indicated by a dot. B. Model of the Zta-meZRE3 complex viewed along the pseudodyad. The methylation sensitive C189 residue (red asterisk) and bidentate hydrogen bond interactions between R190Left and Guanine0′ (dotted black lines) are indicated. Cytosine methyl groups are semi-transparent. C. Orthogonal view. The hydrophobic contact between Cytosine1′ and S186Left (broken blue line) and hydrogen bond network involving S186Left, N182Left and Guanine2′ (dotted black lines) are shown. D. Schematic summary of contacts. van der Waals contacts involving the CpG methyl groups and Zta residues are shown as broken lines.

