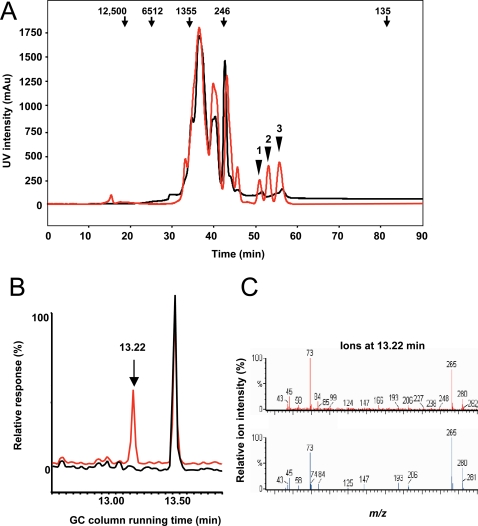
Figure 2. Identification of a soluble factor that induces TNF secretion by DC.
(A) Ultraviolet chromatogram of the non-hydrophobic fraction from the conditioned medium of P. yoelii infected erythrocytes (red) compared to the non-hydrophobic fraction of the conditioned medium of uninfected erythrocytes (black) from a sizing HPLC column. Arrows indicate the position of molecular weight standards. Arrowheads point to three peaks collected for mass spectrometry analysis. (B) Total ion current plot from GC-EI-MS analysis of the TMS-derivatized fraction 1 (red) from A compared to the reagent blank (black). (C) Top, full EI-MS of the 13.22 min fraction in A. Bottom, matching mass spectrum from the NIST database identifying hypoxanthine as high confidence match.

