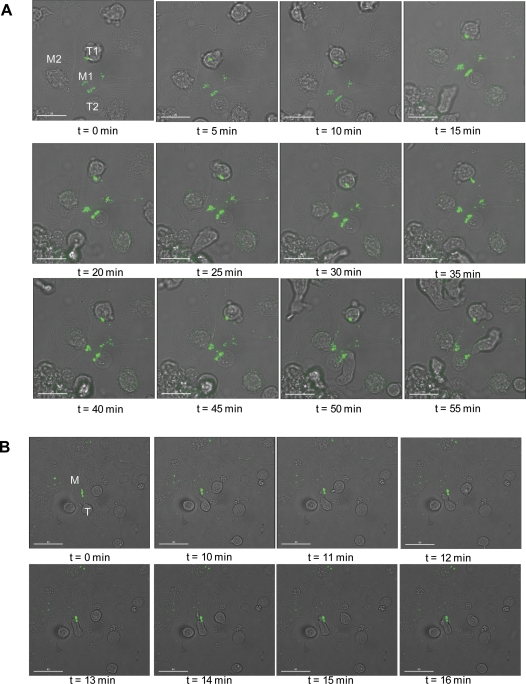
Figure 9. Real-time trafficking of Gag to the synapse in infected MDMs.
(A) MDMs infected with VSV-G-pseudotyped NL4-3/MA-TC virus were labeled with FlAsH 48 hrs postinfection. Jurkat T-cells were added to the FlAsH-labeled cultures and incubated on the microscope stage in a closed chamber (37°C /5% CO2). Time t = 0 min is 40 min (gallery A) or 70 min (gallery B) after addition of Jurkat cells. M1 = infected MDM; M2 = non-infected MDM; T1 and T2 are Jurkat T-cells. Scale bars = 20 µm in A and 40 µm in B. For a movie of Gag movement to the synapse, derived from the experiment presented in Fig. 9A, see Video S7.

