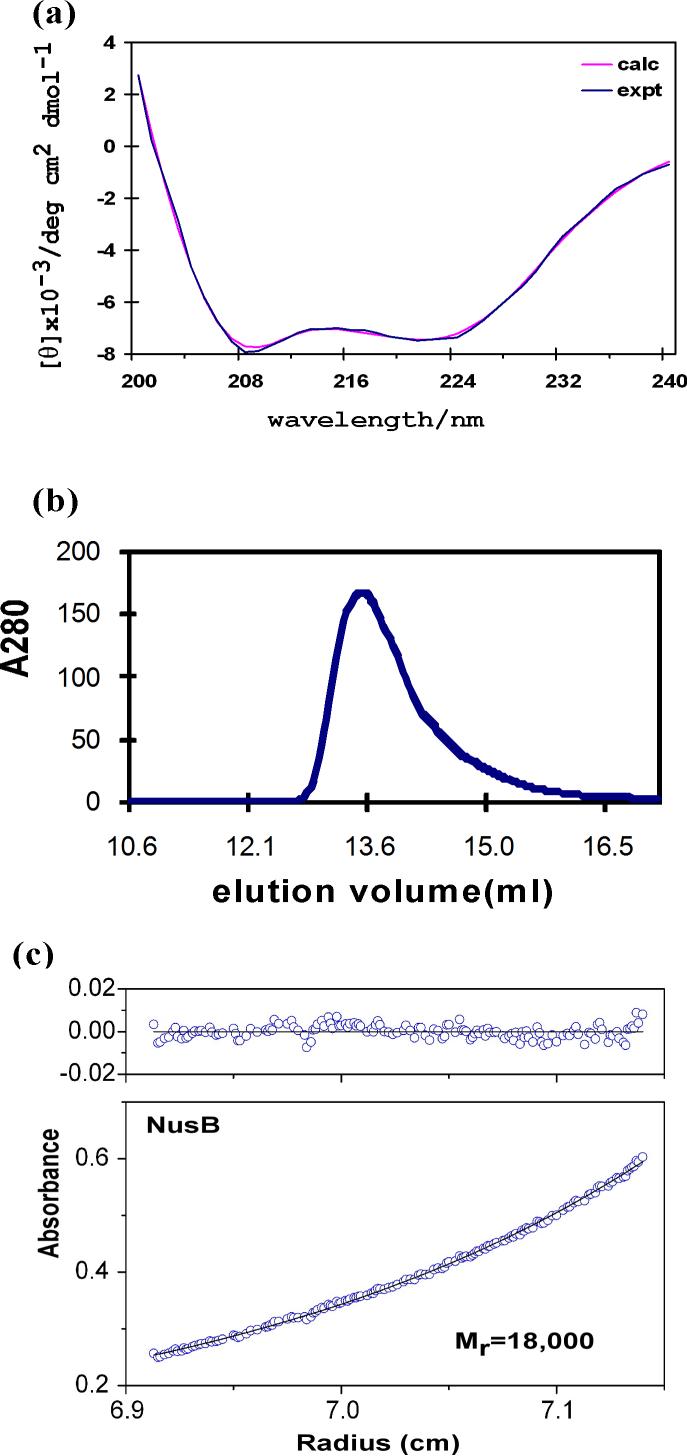
Figure 1.
Characterization of AqNusB. (a) Far UV-CD spectra. The data is drawn in blue and the calculated curve from the CONTIN algorithm is drawn in pink. (b) gel-filtration of AqNusB shows the protein elutes at 13.8 ml corresponding to 17 kDa (expected 17 kDa). (c)Analytical ultracentrifugation results on AqNusB yielded a molecular weight of 18 kDa at 100 μM protein concentration.

