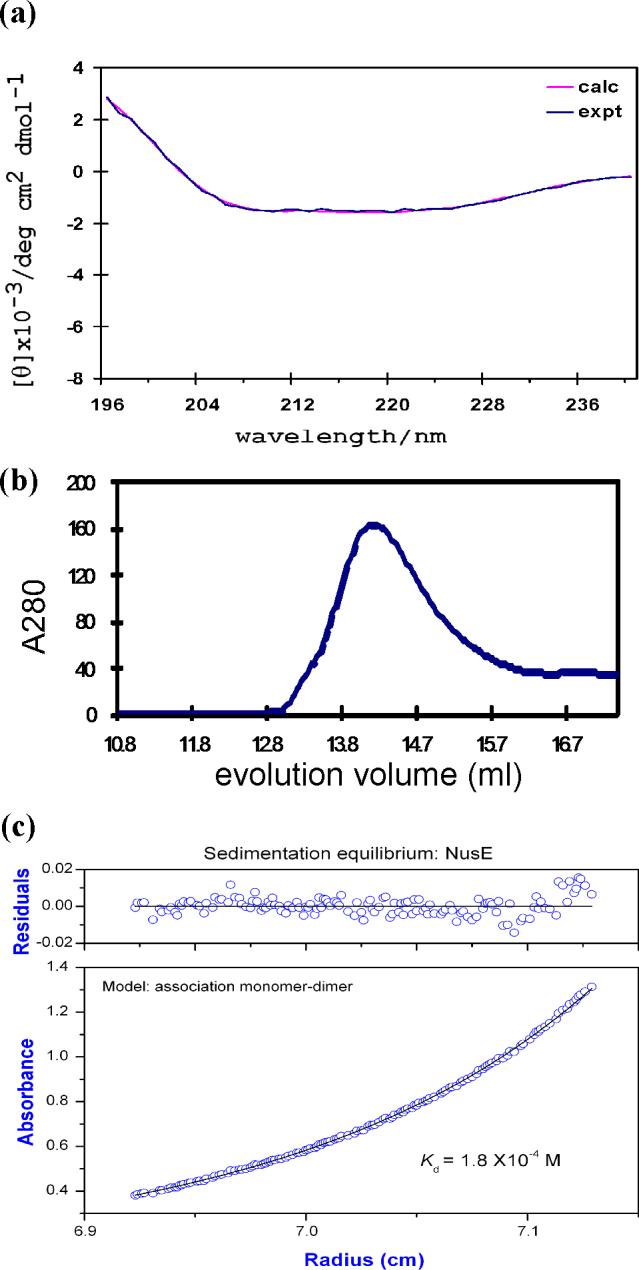
Figure 4.

Characterization of AqNusE. (a) Far UV-CD spectra. The experimental data is drawn in blue and the curve fit from the CONTIN algorithm is drawn in pink. (b)Size exclusion data of AqNusE at 5 μM. AqNusE elutes at 14.6 ml corresponding to 14(±1) kDa using a calibrated curve (see Materials and Methods). The expected molecular weight from the amino acid sequence is 13.5 kDa. A dilution factor of 1.5−2 was taken into consideration for the column. (c) Sedimentation equilibrium results for a 50 μM sample of AqNusE yields a molecular weight of 18 (±1.1) kDa. The data fit best to a monomer↔dimer model with a resulting Kd = 180 (±25) μM.
