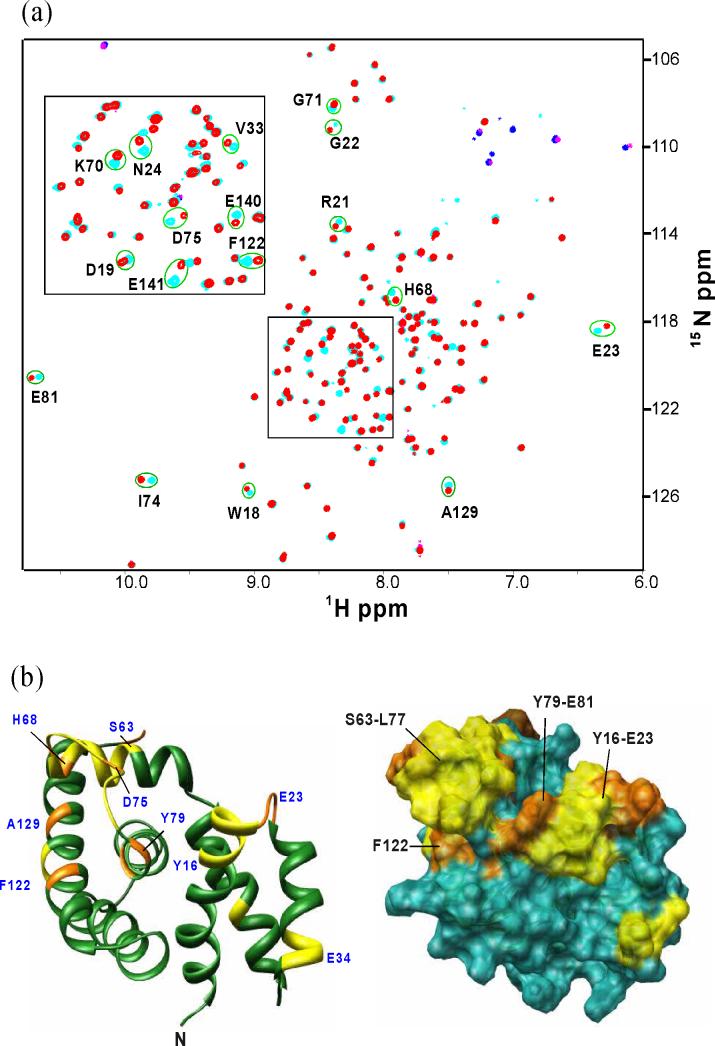
Figure 6.
Chemical shift perturbation of AqNusB by AqNusE. (a) Comparison of TROSY-HSQC spectrum of 15N, 2H-labeled AqNusB when it is free (cyan) and in complex with unlabeled AqNusE (red). Folded peaks from Arginine side chains appear in blue in the free form and magenta in the complex spectrum, respectively. (b) Mapping of AqNusB residues showing significant chemical shifts when NusE binds. The C-terminal residues 142−148 are unaffected by NusE and are not displayed for clarity. Residues showing Δδ > 0.4 ppm are colored orange, <0.2 ppm Δδ < 0.4 ppm are colored yellow, while Δδ < 0.2 ppm are colored dark green. Some significant perturbed residues are numbered in blue. The surface representation is similar except that the Δδ < 0.2 ppm residues are colored in sea-green. The shift mapping indicates two sites with significant shifts at the residues 63−81 and 18−23.

