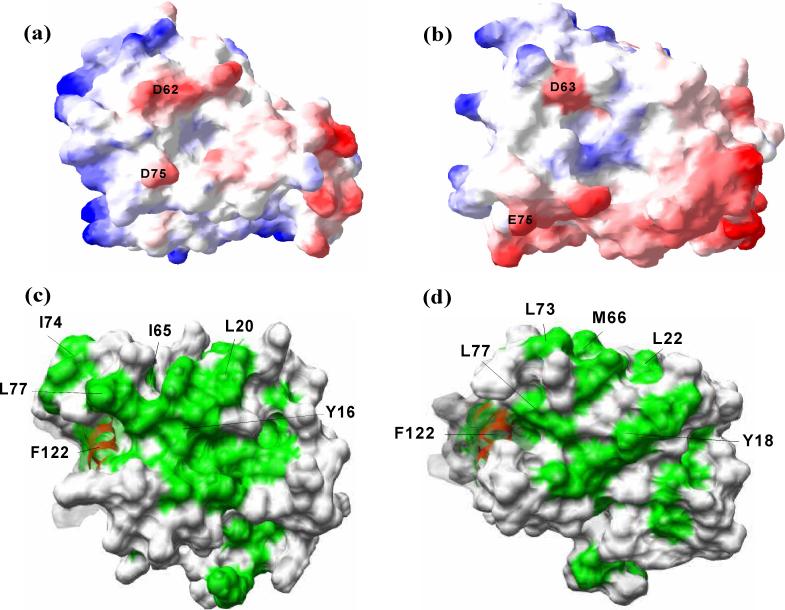
Figure 8.
Comparison of E. coli and Aquifex NusB proteins. Surface charge representation of (a) AqNusB and (b) EcNusB. Negative charged regions are colored in red while positive charged regions are colored in blue. The surface charge was calculation by Poisson's distribution in SwissPDB viewer49 at 100 mM salt concentration. The hydrophobic (green) and surfaces are shown for Aquifex (c) and E. coli (d). Some conserved residues at the binding site are marked in black. The disordered C-terminal residues 142−148 of AqNusB are omitted for clarity.

