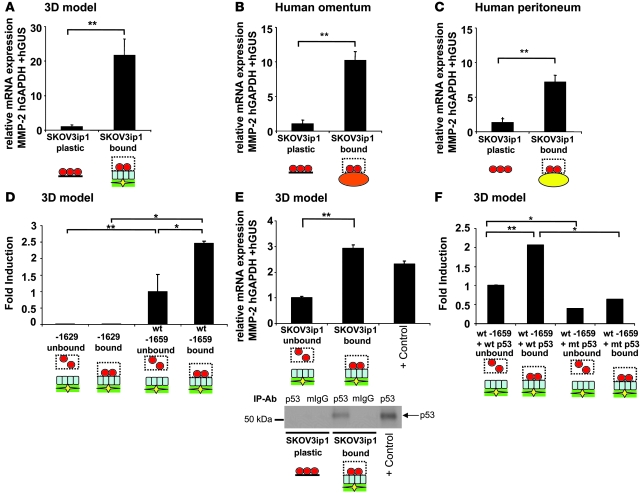
Figure 5. MMP-2 is transcriptionally upregulated in OvCa cells upon interaction with host stroma.
SKOV3ip1 cells were added to the 3D culture (A), full human omentum (B), or full human peritoneum (C), and then cells were sorted by FACS. The relative expression of MMP-2 normalized to GAPDH, and huGUS was measured by TaqMan quantitative real-time RT-PCR. (D) SKOV3ip1 cells were transfected with 5 μg of the –1,659-bp (WT) or the –1,629-bp MMP-2 promoter and adhered to 3D model, and luciferase activity was measured. (E) The relative expression of p53 normalized to GAPDH, and huGUS was measured by TaqMan quantitative real-time RT-PCR (top panel). Protein lysates from SKOV3ip1 cells cultured on plastic or 3D culture (after sorting) were immunoprecipitated with control mouse IgG or monoclonal p53 antibody, and western blot analysis for p53 was conducted on lysates using a pantropic sheep anti-p53 antibody (bottom panel). Positive control was RKO mRNA or cell lysates. (F) SKOV3ip1 cells were cotransfected with 5 μg of the WT MMP-2 promoter and a WT or mutated p53 expression plasmid and adhered to the 3D model, and luciferase activity was measured. Luciferase activity was normalized to number of bound and unbound cells, and all assays were run in duplicate. *P < 0.01, **P < 0.001. Each graph is representative of 3 independent experiments.

