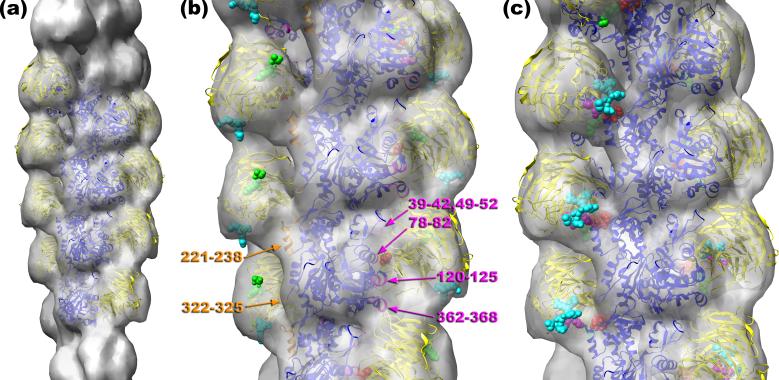
Fig. 3.
To reduce heterogeneity and improve the appearance of coronin the “SD1/2-SD4” class was sorted by the actin twist into three groups: 162°, 166°, and 168°. The reconstruction of the 168° class (n=963) possessed the largest coronin density, and it was used for modeling. The Chimera software35 was used to build up an atomic model of the coronin 1A-F-actin complex (a), which has actin protomers in blue and coronin in yellow. Crystal structures of G-actin36 and murine coronin-17 were docked into the reconstruction manually. The detailed view of the atomic model is shown in (b). Arg30 of coronin-1B is represented as red spheres, with the N-terminus and C-terminus shown as green and cyan spheres, respectively. Actin residues that are at the interface between coronin-1A and F-actin are marked: residues 78-82, 120-125, and 362-368 of SD1, 39-42, and 49-52 of SD2 (magenta ribbons), residues 221-238 of SD4, and finally residues 322-325 of SD3 (orange ribbons). The second site of binding of coronin to SD4 of F-actin (c) involves residues 20-23 (red spheres), residues 65-67 (green spheres), residues 329-331 (magenta spheres), and residues 353-358 (cyan spheres). The coordinates of the model are available at http://people.virginia.edu:80/~ehe2n/coronin.html

