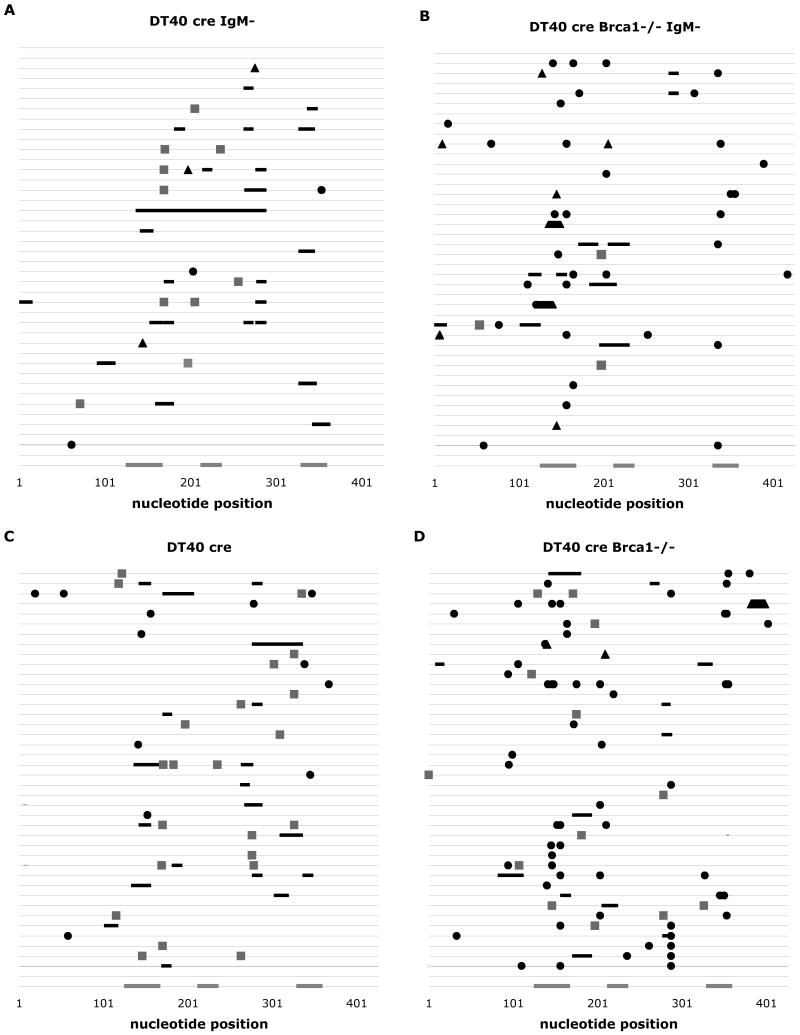
Fig. 3.
Mutation distributions in randomly selected DT40 cre and Brca1-deficient derivatives. Each horizontal line is a map of events in one individual clone plotted with respect to the location in a 427-basepair region of Vλ. Nucleotide positions are indicated on the X-axis, and the three gray rectangles indicate the location of the three CDRs. Mutations from cells sorted for IgM loss are shown in plots (A) and (B), and from unsorted populations in plots (C) and (D). Filled circles represent non-templated point mutations, black lines represent gene conversions, filled trapezoids and triangles represent insertions and deletions, and gray squares are ambiguous events.

