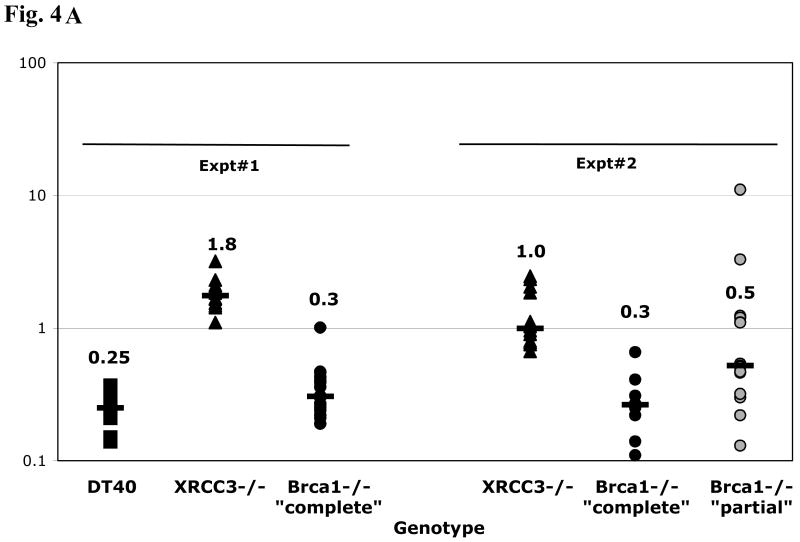
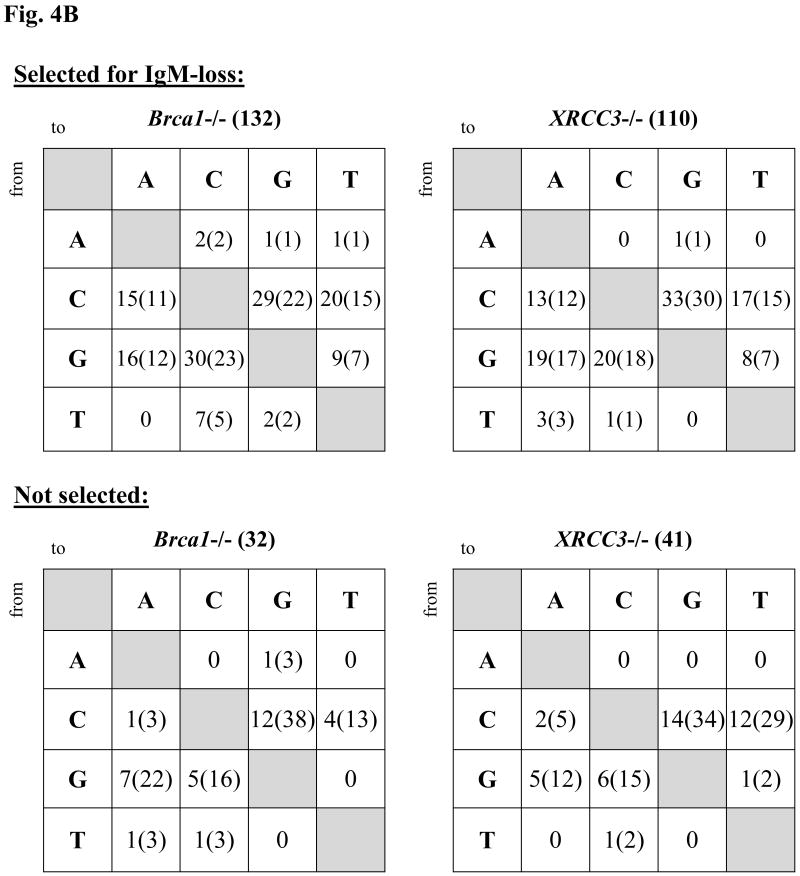
Fig. 4.
Frequency of IgM loss and mutation pattern in DT40 and derivatives deficient for XRCC3 or Brca1. (A) Frequency: Two independent experiments are shown. Each symbol represents the percentage of IgM-loss variants in an individual subclone after five weeks of culture. The median percentage of IgM-loss of all subclones of a particular genotype is plotted as a large dash, with the value indicated above each set. (B) Patterns of non-templated point mutations in Vλ, with or without selection for surface IgM phenotype. Raw numbers (% of total mutations).


