
Figure 2.
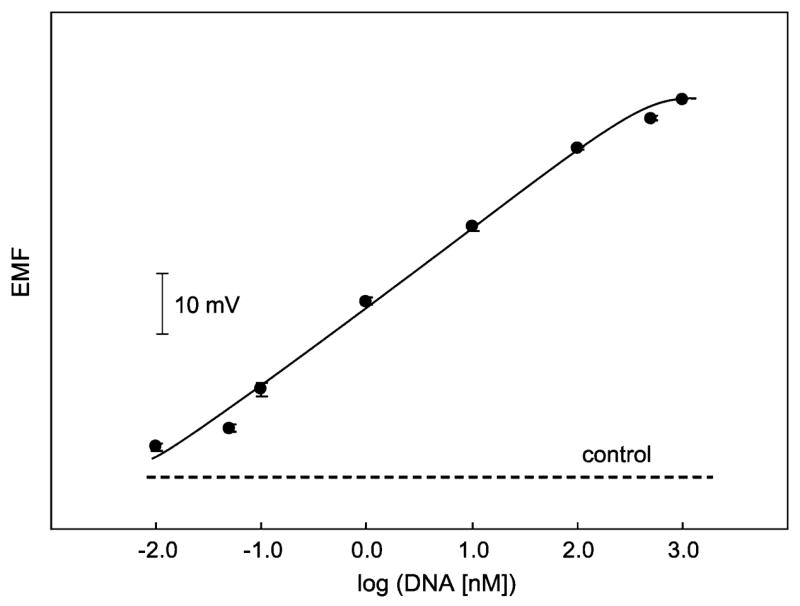
Calibration plot for the potentiometric monitoring of DNA with a sandwich array based on CdS quantum dot tags in 200-μL microwells (error bars: SD, N = 3). The dashed line corresponds to control signal (no target). Other conditions as in Figure 1.