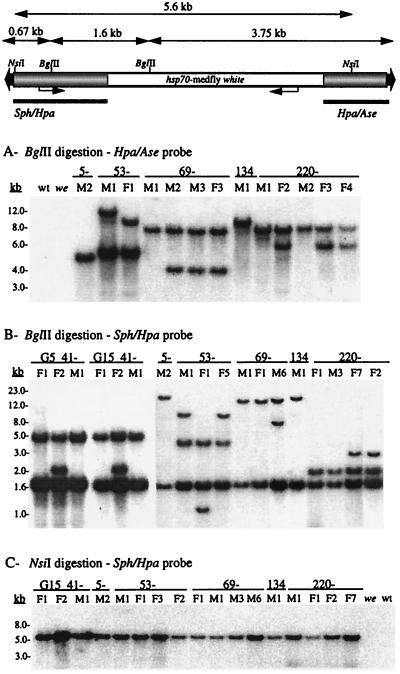
Figure 2.
Southern DNA blot hybridization analysis of Cc[pBw] transformant sublines, and we host strain and wild-type (wt) control samples. At the top is a schematic diagram (not to scale) of the pB[Ccw] vector showing the BglII and NsiI restriction sites used to digest the genomic DNA and the 1.4-kb SphI–HpaI and 0.95-kb HpaI–AseI piggyBac vector fragments used as hybridization probes (bars). Above the schematic are distances used to calculate internal restriction fragment sizes and minimum sizes for junction fragments. Vector sequences are shaded, and the hsp70-white marker sequences are open. DNA size markers are shown to the left of the autoradiograms.

