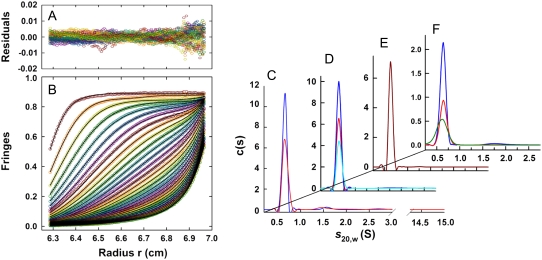
FIGURE 1.
Summary of sedimentation velocity runs for the soluble component of hIAPP (data collected at 60 krpm). (Left) Typical sedimentation velocity profiles (obtained on a precleared sample at pH = 4.9, T = 4°C, and c = 55 μM) shown in terms of interference fringes versus radius (B), and pooled residuals from the fit (A). For clarity, scans are shown at 50-min intervals (every 10th scan with every eighth interference data point shown). Lines are best-fit curves obtained from a continuous c(s) analysis. (Right) The c(s) distributions obtained for: (C) precleared samples at pH = 4.9, T = 4°C, c = 68 μM (blue), and c = 55 μM (red), using interference optics; (D) samples filtered but not prespun in the preparative centrifuge before loading, at pH = 4.9, T = 4.0°C, c = 59 μM, λ = 236 nm (cyan), c = 150 μM, λ = 236 nm (blue), c = 230 μM, and λ = 280 nm data multiplied by 1.5 for clarity (red); (E) pH = 4.9, T = 20°C, and c = 55 μM using interference optics; and (F) pH dependence at 4.0°C, pH 6.2 (red, c = 82 μM, λ = 280 nm), pH 7.4 (green, c = 76 μM, λ = 280 nm), and pH 7.9 (blue, c = 59 μM, λ = 236 nm).

