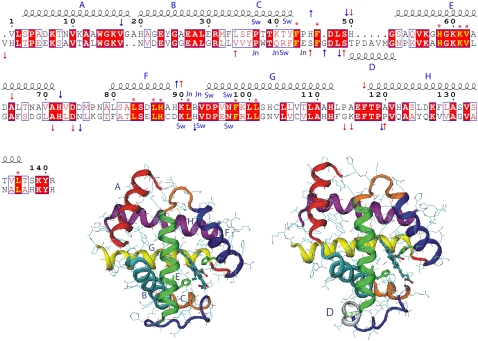
FIGURE 11.
Sequence alignment of HbA chains relative to the α-chain. The first alignment line is that of the α-chain and the second that of the β-chain. Helices are drawn and named (A–G) above the residue numbering. Helix D (50–56), which occurs only in the β-chain, is shown below the alignment lines. Strictly conserved residues are in red blocks and highly homologous residues are in red type inserted in blue boxes. Red asterisks indicate conserved residues located in the heme pocket. The proximal and distal His residues are at positions 87 and 58 in the α-chains and at positions 92 and 63 in the β-chain. Arrows indicate the regions of R-Hb (red) and T-Hb (blue) where motions are affected by the presence of DPG. Residues that belong to the switch region are labeled as Sw (α1-Thr38, α1-Thr41, α1-Tyr42, α1-Asp94, α1-Asn97, β2-Arg40, β2-His97, β2-Asp99, and β2-Asn102) and joint region residues as Jn (α1-Leu91, α1-Arg42, α1-Asp94, β2-Trp37, β2-Gln39, β2-Arg40, and β2-Asn102). The alignment was performed using the program ClustalW, version 1.83 (98), and the figure was generated with ESPript, version 2.1 (99) with the various labels added manually. Ribbon renderings of an α-chain (all helices labeled) and a β-chain (only helix D labeled). The loop regions are color-coded as follows: blue, CE loop region; orange, EF loop; and red, FG loop. The structures were generated using the 1hho.pdb coordinates and the program VMD.

