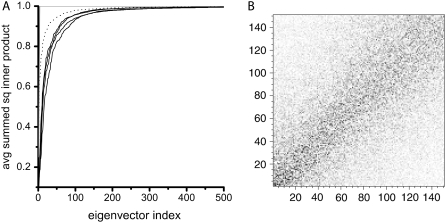
FIGURE 4.
(A) Average summed square inner products for the first 10 eigenvectors of one 1-ns simulation with all the eigenvectors of a second 1-ns simulation, averaged over all pairs for all models: R-Hb, T-Hb, Rdpg, and Tdpg (black traces). The dotted line is the result obtained for the comparison of a 500-ps subset of the R-Hb 1-ns simulation compared to an entire 1-ns simulation. The gray trace represents identity (straight line on top of the graph), i.e., the inner product of the first 10 eigenvectors of one 1-ns simulation with themselves. (B) Squared inner product matrix for the α1 subunit of R-Hb showing the eigenvectors calculated from the first half of the trajectory projected onto those calculated for the second half.

