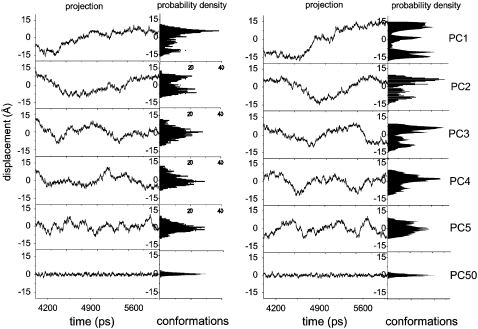
FIGURE 5.
Projection of the Cα-atom trajectory along the first five eigenvectors of the covariance matrices of the R-oxyHb models without (left) and with (right) DPG. On the righthand side, histograms of the fluctuations show the corresponding probability distributions. For comparative purposes, “Gaussian” PC50 is also included.

