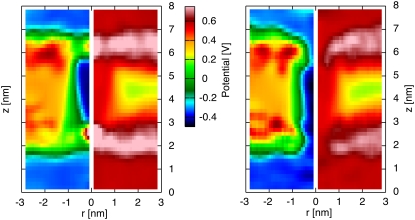
FIGURE 5.
Potential maps on the (r, z)-plane for a naked CNT (left panel) and decorated H/OH CNT (right panel), acting as nanopores in a DMPC lipid bilayer. Standard deviation (right half of each figure) and averaged mean value (left half of each figure) of the electrostatic potential maps on the (r, z) plane. The standard deviation is largest in the area occupied by the lipid heads, indicating their enhanced fanning in the presence of the CNT and lowest in the center of the lipid bilayer.

