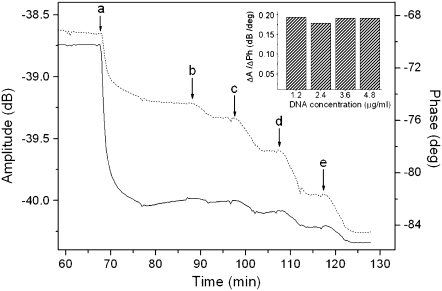
FIGURE 3.
Real-time binding curve of amplitude and phase change during the application of (a) neutravidin 100 μg/ml, followed by 167-bp DNA samples of (b) 1.2, (c) 2.4, (d) 3.6, and (e) 4.8 μg/ml. Buffer-washing steps following each deposition are not shown in the graph. Amplitude and phase are depicted with a dotted and solid line, respectively. (Inset) Acoustic ratio of amplitude change versus phase change (ΔA/ΔPh) measured for each DNA addition.

