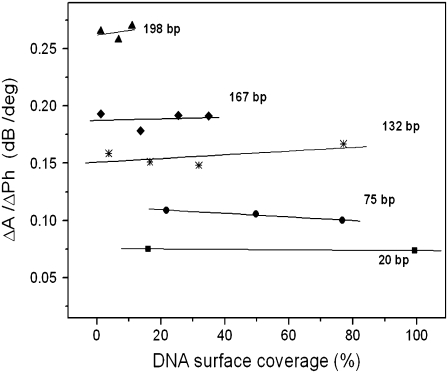
FIGURE 4.
Plot of the acoustic ratio (ΔA/ΔPh) versus the % of DNA surface coverage for the 198 (▴), 167 (♦), 132 (*), 75 (•), and 20 (▪) bp dsDNA molecules corresponding to a contour length of 67.3, 56.8, 44.9, 25.5, and 6.8 nm, respectively. The y and x axes are equivalent to  or [η] and
  respectively (see section on model analysis).

