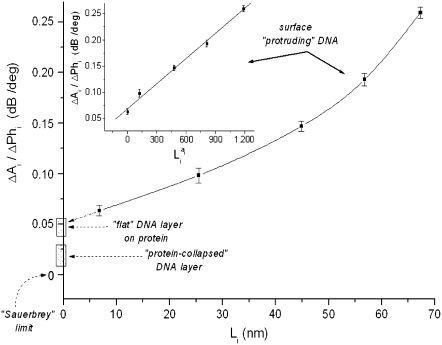
FIGURE 6.
Plot of the ratio ΔA/ΔPh versus contour length  of straight DNA molecules;
  values are calculated for each length
  from Eq. 6. The straight line (inset) is a linear fit (R = 0.997) of the data. Also indicated, as boxes on the y axis, are the various cases of formed layer rigidity (see text). The y axis is equivalent to
  or [η] (see Model Analysis).

