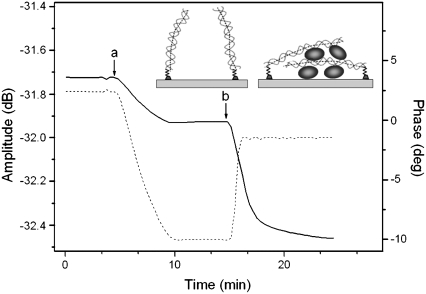
FIGURE 7.
Real-time binding curve of amplitude and phase change during the application of neutravidin (not shown) followed by (a) 198-bp dsDNA sample of 5 μg/ml and (b) 250 μg/ml of histone Hv1. Amplitude and phase are depicted with a dotted and solid line, respectively. Also shown is a schematic representation of the DNA configuration on the surface before and after the addition of the histone.

