Abstract
In MRI, macroscopic boundaries lead to a diffusion-related increase in signal intensity near them—an effect commonly referred to as edge-enhancement. In diffusion-weighted imaging protocols where the signal attenuation due to diffusion results predominantly from the application of magnetic field gradients, edge-enhancement will depend on the orientation of these diffusion gradients. The resulting diffusion anisotropy can be exploited to map the direction normal to the macroscopic boundary. Simulations suggest that the hypothesized anisotropy may be within observable limits even when the voxel contains no boundary itself—hence, the name remote-anisotropy. Moreover, for certain experimental parameters there may be significant phase cancellations within the voxel that may lead to an edge detraction effect. When this is avoided, the eigenvector corresponding to the smallest eigenvalue of the diffusion tensor obtained from diffusion-tensor imaging can be used to create surface-normal maps conveniently. Experiments performed on simple geometric constructs as well as real tissue demonstrate the feasibility of using the edge-enhancement mechanism to map orientations orthogonal to macroscopic surfaces, which may be used to assess the integrity of tissue and organ boundaries noninvasively.
INTRODUCTION
Diffusion-weighted (DW) MRI has traditionally been used to observe diffusion in restricted domains whose characteristic dimensions are much smaller than the voxel size. The orientational dependence (anisotropy) of the MR signal has been used most widely in observing the white-matter in the central nervous system that is composed of axons whose diameters are in the 0.5–10-μm range. Anisotropy observed in such MRI acquisitions is believed to be due primarily to the influence of cell membranes on the diffusing molecules (1,2). Due to the coarse resolution of typical MRI scans, an image voxel contains thousands of axons; hence, the observed anisotropy is a product of the cumulative effect of the membranes of thousands of cells. Local average orientations of the axonal cells can be estimated from the directions of highest diffusional mobility (3,4).
Random motion of molecules in liquid and gas phases tend to attenuate the MR signal significantly. When the spin-bearing particles are located in the proximity of restricting walls, their motion is hindered; this manifests itself in the detected MR signal. Specifically in imaging studies, when the voxel dimension is smaller than the characteristic dimensions of the restricting geometry, it was shown that, even when the spin density is constant, voxels close to the boundaries suffer less attenuation (5) in constant-gradient experiments leading to the edge-enhancement effect. This effect was observed in thin glass-capillaries (6,7) and can be attributed to diffusion-related lineshape distortion (8). However, diffusive attenuation was shown to be a more likely cause of edge-enhancement (9)—particularly so in spin-echo experiments (10). The presence of constant-field-gradients in spin-echo experiments was studied further (11) using the eigenstates of the Torrey equation (12) and subsequently, predictions were made for the shapes of the edge-enhancement profiles in frequency as well as phase-encoding schemes (13). In Callaghan and Codd (14), the authors employed a matrix product formalism (15) to estimate the image intensity in restricted geometries for general pulse sequences. A similar random walk approach was taken to study the free induction decay and spin-echo signal intensities in constant-field-gradient experiments (16). In Stepišnik et al. (17), a cumulant expansion approach was used to address the problem.
In DW acquisitions, where the effects of diffusion on the MR signal intensity are controlled typically via the application of a pair of magnetic field gradient pulses (18), edge-enhancement was predicted to vary with the strengths and directions of these gradient pulses (19). Consequently, the DW signal may be sensitive to structures whose sizes are comparable to or greater than the voxel dimensions. We predict that the DW signal may be anisotropic even when the imaged voxel contains no structure. An example to this remote-anisotropy effect is the voxel of interest that contains nothing but cerebrospinal fluid located in the proximity of the cortical surface of the brain. In this article, we study one- and two-infinite-plate geometries that are expected to represent many situations of interest well. Unlike most studies that employ an eigenfunction expansion for the diffusion propagator, the solutions for magnetization density and signal intensity are obtained using the method of images, which is adequate for the length scales associated with the problem. Our simulations suggest that anisotropy due to edge enhancement can be exploited to estimate the directions perpendicular to nearby boundaries. Experiments performed on simple geometric constructs and a rat brain sample verify this prediction.
THEORY
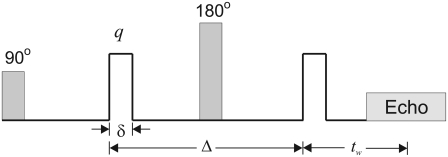
We consider the pulsed gradient spin echo (PGSE) experiment (18) shown in Fig. 1. We assume the diffusion pulse durations (δ) and the time between the application of the second diffusion gradient and the echo center (waiting time, tw) to be small. Note that the effects of finite waiting times will be discussed in detail in the Appendix. Moreover, we ignore the diffusion-related effects of imaging gradients. The magnetization density at the echo time induced by this pulse sequence is given by Sukstanskii et al. (20),
 |
(1) |
where ρ(z) is the initial spin distribution; q = γδGz/2π is the component of the wave vector along the z-direction; γ is the gyromagnetic ratio, and Gz is the z-component of the gradient vector. P(z0, z, Δ) is the propagator indicating the probability of particles initially at location z0 ending up at position z after time Δ. Here, diffusion is thought to be restricted along the z-direction but free along other directions.
FIGURE 1.
A schematic of the PGSE sequence. The shaded boxes show the RF pulses while the blank boxes depict the gradients. The diffusion pulses have duration δ, which is assumed to be small. The diffusion time is given by Δ. The waiting time, i.e., the time between the application of the second diffusion gradient pulse and the echo center, is denoted by tw.
The total signal that is observed in a voxel will depend on the image acquisition and reconstruction schemes (slice excitation profile, point spread function, … etc.) as well as the magnetization density profile given in Eq. 1. As an ideal case, we can assume that all spins inside the voxel will contribute to the total signal equally. In this case, the signal attenuation in a voxel located between the points z1 and z2 can be estimated by integrating the magnetization density over the voxel:
 |
(2) |
When the gradient is applied along an arbitrary direction, this attenuation needs to be multiplied by the attenuation due to the components of the gradients along the x and y directions.
We have derived the signal intensity in two simple geometries (see Fig. 2) that are expected to represent real macroscopic boundaries well. These follow.
FIGURE 2.
Two geometries considered in the article. (a) The voxel is situated at a distance z1 away from a single infinite plate whose normal is along the z-direction, and the gradient vector makes an angle θ with the infinite plate. (b) A second plate is placed at the proximity of the voxel, where the spacing between the two plates is L. In both cases, the height of the voxel is (z2 – z1).
Single infinite plate
When the voxel dimensions are significantly smaller than the separation between the restricting boundaries, and when the voxel is situated close to one of the boundaries, the magnetization in the voxel is influenced only by the nearby boundary. In this case, diffusion can be thought to be taking place in the proximity of a single infinite plate located at z = 0 (Fig. 2 a). The propagator can be obtained by using the method of images to be (21)
 |
(3) |
where u is a characteristic diffusion length given by
 |
(4) |
and D0 is the free diffusion coefficient.
Furthermore, it is convenient to introduce the dimensionless position and wave-number variables
 |
(5) |
The resulting magnetization density is calculated using Eq. 1:
 |
(6) |
Finally, the signal from the voxel is calculated by integrating the magnetization density over the voxel as in Eq. 2, and is given by
 |
(7) |
where ζ1 and ζ2 are the dimensionless coordinates of the voxel's boundaries corresponding to z1 and z2, respectively, and
 |
(8) |
Two infinite parallel plates
Next, we consider the case of diffusion taking place between two infinite impermeable parallel plates separated by a distance L as shown in Fig. 2 b. In addition to the definitions in Eqs. 4 and 5, we introduce the dimensionless length of the spacing to be
 |
(9) |
The method of images is used to provide the small-time representation of the propagator and makes it possible to achieve an accurate approximation by retaining only a few terms of the infinite series (22):
 |
(10) |
Using Eq. 1, the magnetization density is obtained to be
 |
(11) |
The signal attenuation expected in a voxel located between ζ1 and ζ2 is given by
 |
(12) |
where
 |
(13) |
RESULTS
Simulations
Simulations of the PGSE experiment were performed on the two geometries described above. We confirmed that when the separation of the two parallel plates is taken to be large, the results are the same as those from the one-sided plate, as expected. Moreover, thanks to the form of the propagator obtained via the method of images, it is sufficient to keep only a few terms of the infinite series in Eqs. 11 and 12. Although we observed that only three terms (n = −1, 0, 1) were sufficient to obtain very high accuracy, and the contribution from all other terms were negligible, we retained the terms with −5 ≤ n ≤ 5 in the simulations.
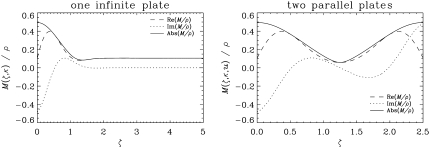
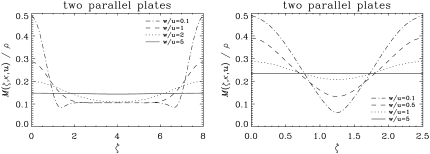
Fig. 3 shows the predicted magnetization density profiles (divided by the initial spin density) as a function of the distance from the infinite plate located at ζ = 0. In both simulations, κ was taken to be 1.5 and u was 40 μm. From the simulation of the first geometry (single infinite plate), it is clear that the effect of one plate extends to a dimensionless distance of ∼1.5. Therefore, in the parallel plate simulations, the dimensionless separation was chosen to be λ = 2.5, which is less than twice this value so that the effects of the two plates are not isolated from each other. Note that, because of the asymmetry of the problem, the local magnetization is in general complex-valued. In the one-sided geometry, as we go from left to right, the absolute value of the magnetization density goes slightly below its eventual free diffusion value, which means the signal at that location is attenuated more than the case in which no restrictions were present. However, this edge-detraction effect is small and occurs at a very small region in space.
FIGURE 3.
The magnetization density profiles as a function of the distance from the infinite plate located at ζ = 0. The left panel illustrates the magnetization density expected from a single infinite plate (see Fig. 2 a). The right panel depicts the same for two parallel plates (see Fig. 2 b) separated from each other by a dimensionless distance λ = 2.5. The acquisition parameters were taken to be: κ = 1.5, u = 40 μm, and tw = δ = 0. In both cases, the magnetization density is normalized via a division by the initial spin density yielding a dimensionless quantity.
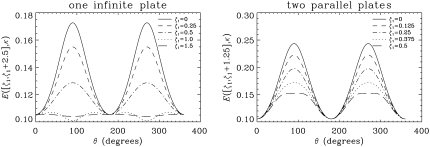
To understand the anisotropy of the diffusion signal, in Fig. 4 we plot the diffusion-attenuated MR signal as a function of the angle between the gradient direction and the infinite plates (θ) for various locations of the imaging voxel. The dimensionless voxel size (ζ2 – ζ1) was taken to be 2.5 and 1.25 for the one- and two-infinite-plate geometries, respectively. A significant level of anisotropy is observed when the voxels are situated sufficiently close to the restricting walls. Note that when θ is 0° and 180°, the signal takes its free diffusion value. In the single-plate geometry, when ζ1 was taken to be 1.0, the signal at 90° and 270° is lower than the free diffusion intensity. This is a consequence of the above-mentioned edge detraction effect, where phase cancellations due to the integration of the complex-valued magnetization over the voxel introduce additional loss of signal. However, note that this effect is small and occurs when the voxel is away from the infinite plate.
FIGURE 4.
The signal values as a function of the angle between the infinite plate and the gradient direction (θ) for a single infinite plate (left) and two parallel plates (right). All parameters of the simulations were kept the same with those in Fig. 3. The length of the voxel along the z-direction (ζ2 – ζ1 value) was taken to be 2.5 and 1.25 for the one-sided plate and two-plate geometries, respectively.
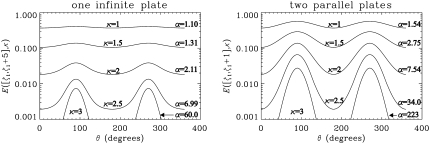
In Fig. 5, we show the angular variation of the expected signal attenuations for various levels of diffusion-weighting (κ-values) in semilogarithmic plots. The dimensionless voxel sizes were taken to be 5 and 1 for the one- and two-parallel-plate geometries, respectively. The voxels were assumed to be adjacent to the infinite plates at ζ = 0. We define α = E(θ = 90°)/E(θ = 0°) to be a simple measure of anisotropy. Detectable levels of anisotropy were observed in both geometries even at low κ-values. However, anisotropy rapidly increases with increasing gradient strength.
FIGURE 5.
The signal values as a function of the angle between the infinite plate and the gradient direction (θ) for a single infinite plate (left) and two parallel plates (right) for various levels of diffusion weighting (κ varied between 1 and 3). All parameters of the simulations were kept the same with those in Fig. 3. The voxel was taken to start at ζ = 0 and its length along the z-direction (ζ2 – ζ1 value) was taken to be 5 and 1 for the one- and two-plate geometries, respectively.
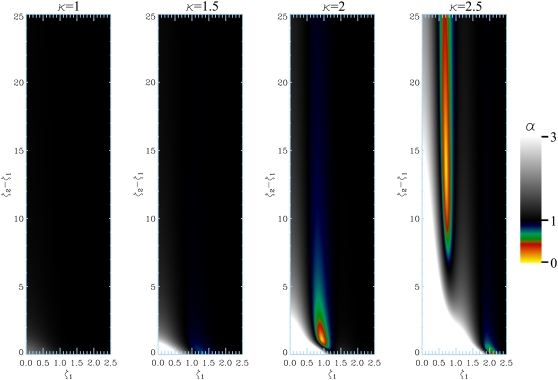
To understand the scope of the edge-detraction effect, we focus on the single infinite plate geometry and compute the anisotropy as a function of the location of the voxel and the voxel size for various values of κ. Fig. 6 illustrates the anisotropy values. When α is >1, the anisotropy is due to the edge-enhancement effect; these regions are shown in grayscale where the brighter regions correspond to larger values of anisotropy. The paradoxical anisotropy (α < 1) due to the edge-detraction effect is shown in color. When the voxel is situated reasonably close to the boundary, i.e., when ζ1 is small, anisotropy is certainly due to edge enhancement. The paradoxical anisotropy is most pronounced at higher values of the wave-number (κ) because phase wraparound occurs at shorter distances. These results help us conclude that for lower diffusion gradient strengths and when the voxel is located close to the restrictions, one can assume that maximum signal will be obtained when the diffusion gradients are perpendicular to the macroscopic surfaces.
FIGURE 6.
The anisotropy (α = E([ζ1, ζ2], κ, θ = 90°)/Efree) map displayed as a function of the distance from the infinite plate (ζ1) and the voxel size (ζ2 – ζ1) for different levels of diffusion-weighting (left to right; κ between 1 and 2.5).
The observation that the gradient orientation associated with the highest value of the signal corresponds to the surface-normal lends itself to a novel application of diffusion-tensor imaging (DTI): we expect that the eigenvector corresponding to the smallest eigenvalue of the diffusion tensor should be parallel to the surface-normal.
Experiments
To test whether the predicted anisotropy due to macroscopic boundaries is experimentally realizable, we performed a series of acquisitions on simple geometric constructs as well as a rat brain. All images were acquired using a 7T vertical bore magnet with an Avance imaging console (Bruker, Ettlingen, Germany).
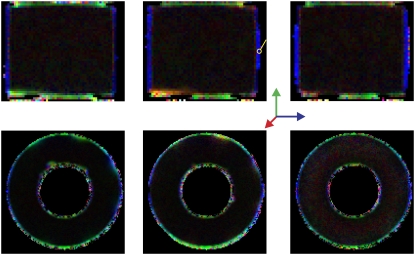
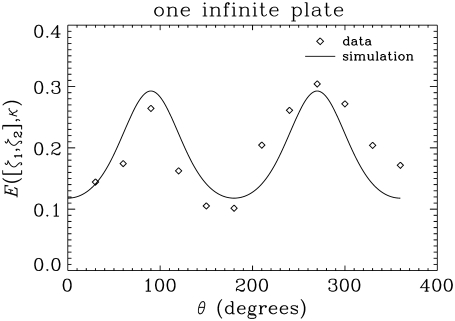
A cylindrical-shaped object with a rectangular void was constructed in-house from Ultem 1000 material (Boedeker Plastics, Shiner, TX), whose susceptibility is similar to that of water. The smallest spacing between two parallel faces of the rectangular void was 4 mm. The resolution of the image was 78 × 312.5 μm2 in plane, and the slice thickness was 1.5 mm. Other acquisition parameters were bmax = 1100 s/mm2, Δ = 150 ms, δ = 3 ms, TE = 167.4 ms, TR = 3 s, and tw = 7.1 ms. A total of 37 images with different gradient directions and strengths were used. The direction-encoded color maps (23) computed from the eigenvector of the tensor corresponding to its smallest eigenvalue are shown on the first row of Fig. 7. Clearly, the eigenvectors in the voxels near the edges are coherently oriented perpendicular to the surfaces. In Fig. 8, we plot the angular dependence of the MR signal intensity observed in a representative voxel, which is depicted with a yellow circle in the middle image of the top row in Fig. 7. Also shown in Fig. 8 is the simulated signal intensity. It is not possible to determine the exact position of the voxel with respect to the surface. We have found empirically that reasonable consistency with data is achieved when it is assumed that 44% of the voxel contains water. It is clear that the observed anisotropy is qualitatively consistent with the simulations.
FIGURE 7.
Direction-encoded color maps computed by using the eigenvector of the tensor associated with the smallest of its eigenvectors for the parallel plates (top row) and the hollow cylinder geometries (bottom row). Note that, in both geometries, the spacing between the restricting walls is so large that diffusion taking place in the proximity of one of the walls is not affected by the other wall.
FIGURE 8.
Data from a representative voxel of the parallel plates image (see the yellow circle in Fig. 7) and the simulations performed with values consistent with the experiment (κ = 1.46). It was assumed that 44% of the voxel remains on the side of the plate that contains water, i.e., ζ1 = 0 and ζ2 = 1.
A hollow cylinder, with a 3.5-mm spacing, was constructed in-house also from Ultem 1000. The parameters of the imaging protocol were almost the same with the following differences: in-plane resolution = 117 × 117 μm2, TE = 163 ms, TR = 2 s, tw = 5.8 ms, and a total of 54 images were acquired. The direction-encoded color maps computed from the third eigenvalue of the tensor accurately revealed the normal vectors on concave as well as convex surfaces as shown in the second row of Fig. 7.
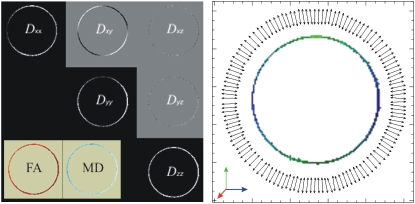
Another hollow cylinder sample[Q1] (Fig. 9) was constructed by inserting a glass rod of diameter 4.10 mm into an NMR tube of inner diameter 4.22 mm (Shigemi, Allison Park, PA). The resolution of the images was 47 μm in plane and the slice thickness was 4 mm. Other imaging parameters were: bmax = 1300 s/mm2, Δ = 51 ms, δ = 3 ms, TE = 64 ms, TR = 1.88 s, tw = 5.8 ms, and the total number of images was 63. The estimated components of the diffusion tensor along with the fractional anisotropy (FA) and mean diffusivity (MD) images (24) are shown on the left. FA and MD values were 0.44 ± 0.11 and 1.41 ± 0.12 μm2/ms across the water-filled region. The eigenvector associated with the smallest eigenvalue of the diffusion tensor and the corresponding color map are shown on the right. The angular deviations of the eigenvectors from the expected orientations (estimated from the location of the voxel with respect to the center of the cylinder) were 1.8 ± 1.6°.
FIGURE 9.
The components of the diffusion tensor estimated from the second hollow cylinder sample along with the fractional anisotropy (FA) and mean diffusivity (MD) images (left panel). FA and MD values were 0.44 ± 0.11 and 1.41 ± 0.12 μm2/ms across the water-filled region, respectively. At the center of the right panel is the direction-encoded color map (23) generated by using the third eigenvector of the diffusion tensor. Also shown are these eigenvectors computed from the medial axis of the hollow cylinder. Every other eigenvector on the medial axis is displayed for clarity. The angular deviations of the eigenvectors from the expected orientations were 1.8 ± 1.6°.
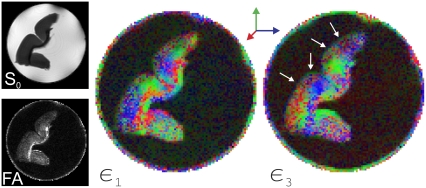
The cortical region of a fixed rat brain was dissected and scanned in a 15-mm NMR tube with 150 μm2 in-plane resolution and 0.75-mm slice thickness. A total of 37 images were collected where the imaging parameters were the same as those in the imaging of the first sample with the following modifications: TE = 161.1 ms, TR = 3.8 s, and tw = 5.3 ms. The left column of Fig. 10 shows the non-DW image (the S0 map) and the FA map both obtained from a diffusion tensor fit to the data. The orientation maps computed from the eigenvectors associated with the largest and smallest eigenvalues are also shown (middle and right columns). Note that we are interested in the outer interface indicated by white arrows on the third eigenvector color map. The other surfaces were compromised due to the dissection process and consequently failed to give meaningful results. However, the third eigenvectors clearly indicate a distinct rim around the cortical surface where the orientation of these eigenvectors is radial. Note that the rat cortex is an ideal tissue to test the predicted remote anisotropy effect because most fibers are arranged radially (4,25) in this region. Therefore, the first eigenvectors are expected to be radial inside the tissue near the boundaries (the color map obtained from the first eigenvector confirms this expectation), which precludes the third eigenvector being oriented radially. Therefore, the existence of the radial rim in the right image suggests that the pixels that form this rim are primarily located outside the brain. We would like to note that when there is partial voluming between the cerebral cortex and the surrounding cerebrospinal fluid, the boundary-induced anisotropy may complicate the interpretation of radial anisotropy observed in various species during development (25–27).
FIGURE 10.
On the left are the non-diffusion-weighted image (S0) and the fractional anisotropy (FA) map computed from the diffusion tensors. The center image shows the orientations of the principal eigenvectors where the rightmost image depicts the orientations of the eigenvector corresponding to the smallest of the three eigenvalues. This map clearly illustrates the directions normal to the cortical surface of the rat brain.
DISCUSSION
In this article, we have investigated the effects of macroscopic boundaries on the pulsed-field-gradient signal from a theoretical as well as experimental standpoint. We have considered two simple geometries that are expected to represent most cases of interest well. In the first geometry, water molecules are reflected by an impermeable single infinite plate, whereas in the second, the water molecules are trapped between two infinite walls separated by a distance larger than the voxel size. The propagators are obtained using the method of images (28) that provided the exact solution for the first geometry whereas for the second, the solution was obtained in the form of an infinite series. Unlike in the case of the eigenfunction expansion of the propagator (29), only a few terms of this infinite series (Eq. 12) are sufficient to obtain a very accurate approximation to the exact result. However, as the spacing between the two infinite plates get smaller, or for longer diffusion times, more terms in this series will be necessary for accurate results. As the spacing approaches microscopic length scales, the eigenfunction expansion will be more efficient.
We showed that for most experimental parameters, the DW signal intensity is greatest when the applied diffusion gradients are perpendicular to the boundaries. However, in some cases there may be a slight anisotropy in the opposite sense—an effect we refer to as edge-detraction. This counterintuitive and previously unrecognized effect is due to phase cancellations within the voxel, which is also responsible for the diffractionlike nonmonotonic dependence of the signal on the diffusion gradient strength (30,31). When the edge-detraction effect is avoided, the directions perpendicular to the boundaries can be mapped conveniently using the eigenvector of the diffusion tensor associated with the smallest of the eigenvalues. Note that the directional ambiguity of the eigenvectors can be overcome by choosing the polarity of the eigenvector so that it will point into the domain of high mean diffusivity.
We have employed the relatively simple DTI model to estimate surface-normals, although our theoretical analysis clearly predicts non-Gaussian diffusion. This is because the information that we are after was relatively easy to extract. The orientational dependence of the signal is what we are seeking to model, and as discussed in more detail above, the gradient direction that yields the highest signal intensity is hypothesized to be parallel to the surface-normal. The DTI model assumes a similar orientational dependence of the signal, where the eigenvector associated with the smallest eigenvalue yields the direction of highest signal intensity. When one is after other characteristics of the nearby surfaces, it may be necessary to fit the full functional form of the predicted signal to the data. Also, models aimed at mapping more than one fiber orientation, such as q-space imaging (32) or the diffusion orientation transform (4), were not needed as, in our application, it is unlikely to encounter corners that would lead to more than one surface-normal at a single voxel. For the same reason, anisotropy was not quantified using relatively sophisticated measures (33). Note that even when such a structure is encountered, the average orientation suggested by DTI may be sufficiently descriptive.
Unlike in the more traditional applications of DTI, such as in mapping fiber orientations, the estimated orientation is less sensitive to noise when one is using the third eigenvector of the diffusion tensor. When the signal/noise ratio is low, one encounters the noise floor along orientations with high diffusivity. Therefore, at low signal/noise ratio, even when the signal from the majority of the gradient orientations may be below the noise floor, one may still detect the orientations associated with the signal increase. This is particularly useful in our application, because the signal that we are interested in originates from freely diffusing molecules, and hence is rapidly decaying.
In this work, we made a number of simplifying assumptions about the restricting walls. Namely, we assumed in our formalism that the interfaces are impermeable and flat. The curvature of the boundaries can be ignored when the voxel size is significantly smaller than the radius of curvature of the nearby surface. This was the case in all experiments performed. Permeability of the interfaces is expected to influence the magnetization density, hence the anisotropy. However, considering the findings in the literature (5,20), we expect to have qualitatively similar results when the boundaries are permeable, although the level of predicted anisotropy may decrease.
Surface-normal estimation is also possible using a single structural scan. In this case, one needs to detect the edges in the image very accurately. Subsequently, by quantifying the local characteristics of the boundaries, one can estimate the surface-normal. Sophisticated computational techniques have been proposed to estimate the differential characteristics of surfaces from a single three-dimensional image (34) and applied to extract the cortical surfaces of the brain (35–38) and the ventricles of the heart (39). Comparing this approach with ours, it is clear that ours is more advantageous in that it uses the information from only one voxel, but has the disadvantage that the diffusion-weighted scans are typically of lower resolution than structural MRI scans. Given that it is possible to obtain reasonable surface-normal maps using a relatively simple method like DTI, which requires only seven DW images, it may be possible to obtain more accurate surface-normal maps using the technique introduced. Also note that our method is expected to perform better when the contrast between free water and tissue is limited, because it would be difficult to obtain accurate edge-maps when there is not significant contrast.
The technique we have proposed may be applicable in characterizing any boundary that serves as a barrier to the displacement of MR-traceable molecules. Specifically, the technique will be most useful in cases where a noninvasive measurement is required, or when the restricting barriers are otherwise nonobservable by MR. Examples for possible applications, with water molecules as the traced molecule, may include the characterization of sulci and gyri in the brain, intraocular surfaces (including the inner surface of the retina, and the lens), the bladder, etc. In all cases, this could be relevant for the study of development as well as the study of pathologies. Other nonclinical applications, using the displacement of water molecules, may include the characterization of the surfaces in plant stems, as well as fruits (40). Potential applications that involve nonhydrogen MRI may include sodium MRI of the kidney (41), or hyperpolarized noble gas imaging of the lungs (42). In both cases, the integrity of membranes and the substructures are critical for assessing the organ's function. Diffusion tensor imaging can aid in resolving structures that are otherwise invisible, e.g., when the concentrations and relaxation rates of the particles in the interfaces are similar to those in the nearby fluid. Finally, for research purposes, this technique can be applied to study cell membranes using the newly available ultra-high field MRI scanners (e.g., 17T and higher) that allow microscopic imaging with sufficient signal/noise ratios (43,44).
Other challenges that we are hoping to address in the near future include segmenting the voxels that contain information about the nearby boundaries, investigating the applicability of multicompartmental models when there is partial voluming between the tissue and otherwise freely diffusing nuclei, and devising optimal acquisition schemes that will improve the quality of the surface-normal mapping.
CONCLUSION
We have shown that the effect of macroscopic boundaries on nearby diffusing nuclei may lead to diffusional anisotropy due to the distortion of the magnetization density, which may be in the form of an edge-enhancement as well as an edge-detraction—a previously unrealized phenomenon. The anisotropy induced by the nearby walls can be observed even in voxels that are free of any structure restricting the motion of molecules. Further, this anisotropy is predicted to be within observable limits. The existence of a detectable anisotropy in the one-sided geometry of the infinite plate demonstrates the feasibility of the approach in virtually all relevant, impermeable, sufficiently smooth, macroscopic boundaries. This alternate source of diffusion anisotropy can be exploited to infer information regarding the structure of nearby walls such as the direction of their surface-normal. Because many structures in the human body (most organs of the gastrointestinal tract, lungs, vessels, … etc.) possess macroscopic boundaries, DW imaging may be useful in examining a host of organs and diseases.
Acknowledgments
This research was supported by the Intramural Research Program of the National Institute of Child Health and Human Development.
APPENDIX
The effect of tw on the magnetization density
In the formalism above, we have set the waiting time, tw, to 0. However, the spins continue to mix after the application of the second gradient pulse. Consequently, the magnetization density at the echo time depends on tw as well. Note that when the voxel contains the entire pore volume, although the magnetization density is changing, the total signal is constant because the spins are still contributing to the result the same way regardless of their location. The fact that we are collecting the signal from a section of the pore volume necessitates the inclusion of tw in a complete analysis.
The normalized magnetization density for finite waiting times is given by
 |
(14) |
Although desirable from a computational point-of-view, an analytical solution based on the method of images is quite difficult in this case. Therefore, we resort to the form of the propagator obtained using the eigenfunction expansion (29)
 |
(15) |
where
 |
(16) |
with ζ, κ, and λ as before and τ may take the values of u = (4D0Δ)1/2 and w = (4D0tw)1/2.
Inserting Eq. 15 into Eq. 14 twice, and carrying out the integrations, the normalized magnetization density is given after some algebra by
 |
(17) |
where
 |
(18) |
and
 |
(19) |
The total signal expected from a voxel can be evaluated using Eq. 2, which is simple because the only spatial dependence in Eq. 17 is in the arguments of the cosine terms. For the sake of brevity we do not include the result of this operation.
Fig. 11 shows the absolute value of the magnetization density profiles computed using Eq. 17 for various tw durations. Since we did not present the solution for the one-sided geometry, on the left panel we show the results when the separation of the two plates was chosen to be large. In this case, for relatively short waiting times, the motions of the spins are not influenced by both plates. Therefore, the results on one-half of the plot are expected to apply to the single-infinite-plate geometry. The right panel depicts the magnetization when the separation of the two plates was chosen to be identical to that in Fig. 3. Therefore, for the smallest tw value, the magnetization density profile is almost identical to the absolute value curve in the right panel of Fig. 3.
FIGURE 11.
The absolute values of the magnetization density profiles for various values of tw. Although both panels depict the results from two parallel plates, the spacing on the left panel is chosen to be so large (λ = 8) that for reasonably short values of tw, the movements of the spins are influenced by at most one of the infinite plates. All parameters used in the right panel (except tw) are the same as those used in generating the right panel of Fig. 3.
The simulations confirm that finite waiting times lead to a smoothing of the magnetization density profiles due to additional mixing of the spins during the tw interval. Note that for very long waiting times, the spins completely lose their motional memories resulting in a homogeneous magnetization distribution similar to the case of free diffusion. Despite the significant changes in the magnetization profiles with changing waiting times, which may result in a decrease in anisotropy, this decrease is expected to be small because the voxel size is in general quite large compared to the characteristic distance traveled by the particles during the tw interval.
Editor: Mark Girvin.
References
- 1.Beaulieu, C., and P. S. Allen. 1994. Determinants of anisotropic water diffusion in nerves. Magn. Reson. Med. 31:394–400. [DOI] [PubMed] [Google Scholar]
- 2.Beaulieu, C. 2002. The basis of anisotropic water diffusion in the nervous system—a technical review. NMR Biomed. 15:435–455. [DOI] [PubMed] [Google Scholar]
- 3.Basser, P. J., J. Mattiello, and D. LeBihan. 1994. MR diffusion tensor spectroscopy and imaging. Biophys. J. 66:259–267. [DOI] [PMC free article] [PubMed] [Google Scholar]
- 4.Özarslan, E., T. M. Shepherd, B. C. Vemuri, S. J. Blackband, and T. H. Mareci. 2006. Resolution of complex tissue microarchitecture using the diffusion orientation transform (DOT). Neuroimage. 31:1086–1103. [DOI] [PubMed] [Google Scholar]
- 5.Hyslop, W. B., and P. C. Lauterbur. 1991. Effects of restricted diffusion on microscopic NMR imaging. J. Magn. Reson. 94:501–510. [Google Scholar]
- 6.Pütz, B., D. Barsky, and K. Schulten. 1991. Edge enhancement by diffusion—microscopic magnetic-resonance-imaging of an ultrathin glass-capillary. Chem. Phys. Lett. 183:391–396. [Google Scholar]
- 7.Barsky, D., B. Pütz, and K. Schulten. 1992. Diffusional edge enhancement observed by NMR in thin glass capillaries. Chem. Phys. Lett. 200:88–96. [Google Scholar]
- 8.Pütz, B., D. Barsky, and K. Schulten. 1992. Edge enhancement by diffusion in microscopic magnetic resonance imaging. J. Magn. Reson. 97:27–53. [Google Scholar]
- 9.Callaghan, P. T., A. Coy, L. C. Forde, and C. J. Rofe. 1993. Diffusive relaxation and edge enhancement in NMR microscopy. J Magn Reson. A. 101:347–350. [Google Scholar]
- 10.Hahn, E. L. 1950. Spin echoes. Phys. Rev. 80:580–594. [Google Scholar]
- 11.de Swiet, T. M., and P. N. Sen. 1994. Decay of nuclear magnetization by bounded diffusion in a constant field gradient. J. Chem. Phys. 100:5597–5604. [Google Scholar]
- 12.Torrey, H. C. 1956. Bloch equations with diffusion terms. Phys. Rev. 104:563–565. [Google Scholar]
- 13.de Swiet, T. M. 1995. Diffusive edge enhancement in imaging. J. Magn. Reson. B. 109:12–18. [Google Scholar]
- 14.Callaghan, P. T., and S. L. Codd. 1998. Generalized calculation of NMR imaging edge effects arising from restricted diffusion in porous media. Magn. Reson. Imaging. 16:471–478. [DOI] [PubMed] [Google Scholar]
- 15.Callaghan, P. T. 1997. A simple matrix formalism for spin echo analysis of restricted difffusion under generalized gradient waveforms. J. Magn. Reson. 129:74–84. [DOI] [PubMed] [Google Scholar]
- 16.Sukstanskii, A. L., and D. A. Yablonskiy. 2002. Effects of restricted diffusion on MR signal formation. J. Magn. Reson. 157:92–105. [DOI] [PubMed] [Google Scholar]
- 17.Stepišnik, J., A. Duh, A. Mohorič, and I. Serša. 1999. MRI edge enhancement as a diffusive discord of spin phase structure. J. Magn. Reson. 137:154–160. [DOI] [PubMed] [Google Scholar]
- 18.Stejskal, E. O., and J. E. Tanner. 1965. Spin diffusion measurements: spin echoes in the presence of a time-dependent field gradient. J. Chem. Phys. 42:288–292. [Google Scholar]
- 19.Sukstanskii, A. L., J. J. H. Ackerman, and D. A. Yablonskiy. 2003. Effects of barrier-induced nuclear spin magnetization inhomogeneities on diffusion-attenuated MR signal. Magn. Reson. Med. 50:735–742. [DOI] [PMC free article] [PubMed] [Google Scholar]
- 20.Sukstanskii, A. L., D. A. Yablonskiy, and J. J. H. Ackerman. 2004. Effects of permeable boundaries on the diffusion-attenuated MR signal: insights from a one-dimensional model. J. Magn. Reson. 170:56–66. [DOI] [PubMed] [Google Scholar]
- 21.Frøhlich, A. F., L. Østergaard, and V. G. Kiselev. 2006. Effect of impermeable boundaries on diffusion-attenuated MR signal. J. Magn. Reson. 179:223–233. [DOI] [PubMed] [Google Scholar]
- 22.Beck, J. V., K. D. Cole, A. Haji-Sheikh, and B. Litkouhi. 1992. Heat Conduction using Green's Functions. Hemisphere, Washington, DC.
- 23.Pajevic, S., and C. Pierpaoli. 1999. Color schemes to represent the orientation of anisotropic tissues from diffusion tensor data: application to white matter fiber tract mapping in the human brain. Magn. Reson. Med. 42:526–540. [PubMed] [Google Scholar]
- 24.Basser, P. J., and C. Pierpaoli. 1996. Microstructural and physiological features of tissues elucidated by quantitative diffusion tensor MRI. J. Magn. Reson. B. 111:209–219. [DOI] [PubMed] [Google Scholar]
- 25.Sizonenko, S. V., E. J. Camm, J. R. Garbow, S. E. Maier, T. E. Inder, C. E. Williams, J. J. Neil, and P. S. Huppi. 2007. Developmental changes and injury induced disruption of the radial organization of the cortex in the immature rat brain revealed by in vivo diffusion tensor MRI. Cereb. Cortex. 17:2609–2617. [DOI] [PMC free article] [PubMed] [Google Scholar]
- 26.Baratti, C., A. S. Barnett, and C. Pierpaoli. 1999. Comparative MR imaging study of brain maturation in kittens with T1, T2, and the trace of the diffusion tensor. Radiology. 210:133–142. [DOI] [PubMed] [Google Scholar]
- 27.McKinstry, R. C., A. Mathur, J. H. Miller, A. Özcan, A. Z. Snyder, G. L. Schefft, C. R. Almli, S. I. Shiran, T. E. Conturo, and J. J. Neil. 2002. Radial organization of developing preterm human cerebral cortex revealed by non-invasive water diffusion anisotropy MRI. Cereb. Cortex. 12:1237–1243. [DOI] [PubMed] [Google Scholar]
- 28.Dennery, P., and A. Krzywicki. 1996. Mathematics for Physicists. Dover Publications, New York.
- 29.Tanner, J. E., and E. O. Stejskal. 1968. Restricted self-diffusion of protons in colloidal systems by the pulsed-gradient, spin-echo method. J. Chem. Phys. 49:1768–1777. [Google Scholar]
- 30.Callaghan, P. T., A. Coy, D. MacGowan, K. J. Packer, and F. O. Zelaya. 1991. Diffraction-like effects in NMR diffusion studies of fluids in porous solids. Nature. 351:467–469. [Google Scholar]
- 31.Özarslan, E., and P. J. Basser. 2007. MR diffusion-“diffraction” phenomenon in multi-pulse-field-gradient experiments. J. Magn. Reson. 188:285–294. [DOI] [PMC free article] [PubMed] [Google Scholar]
- 32.Callaghan, P. T. 1991. Principles of Nuclear Magnetic Resonance Microscopy. Clarendon Press, Oxford.
- 33.Özarslan, E., B. C. Vemuri, and T. H. Mareci. 2005. Generalized scalar measures for diffusion MRI using trace, variance and entropy. Magn. Reson. Med. 53:866–876. [DOI] [PubMed] [Google Scholar]
- 34.Sander, P. T., and S. W. Zucker. 1990. Inferring surface trace and differential structure from 3-D images. IEEE T Patt. Anal. 12:833–854. [Google Scholar]
- 35.Dale, A. M., B. Fischl, and M. I. Sereno. 1999. Cortical surface-based analysis. I. Segmentation and surface reconstruction. Neuroimage. 9:179–194. [DOI] [PubMed] [Google Scholar]
- 36.MacDonald, D., N. Kabani, D. Avis, and A. C. Evans. 2000. Automated 3-D extraction of inner and outer surfaces of cerebral cortex from MRI. Neuroimage. 12:340–356. [DOI] [PubMed] [Google Scholar]
- 37.Fischl, B., A. Liu, and A. M. Dale. 2001. Automated manifold surgery: constructing geometrically accurate and topologically correct models of the human cerebral cortex. IEEE Trans. Med. Imaging. 20:70–80. [DOI] [PubMed] [Google Scholar]
- 38.Tosun, D., M. E. Rettmann, X. Han, X. Tao, C. Xu, S. M. Resnick, D. L. Pham, and J. L. Prince. 2004. Cortical surface segmentation and mapping. Neuroimage. 23:S108–S118. [DOI] [PMC free article] [PubMed] [Google Scholar]
- 39.Friboulet, D., I. E. Magnin, C. Mathieu, A. Pommert, and K. H. Hoehne. 1993. Assessment and visualization of the curvature of the left ventricle from 3D medical images. Comput. Med. Imaging Graph. 17:257–262. [DOI] [PubMed] [Google Scholar]
- 40.As, H. V. 2007. Intact plant MRI for the study of cell water relations, membrane permeability, cell-to-cell and long distance water transport. J. Exp. Bot. 58:743–756. [DOI] [PubMed] [Google Scholar]
- 41.Maril, N., Y. Rosen, G. H. Reynolds, A. Ivanishev, L. Ngo, and R. E. Lenkinski. 2006. Sodium MRI of the human kidney at 3 Tesla. Magn. Reson. Med. 56:1229–1234. [DOI] [PubMed] [Google Scholar]
- 42.van Beek, E. J., J. M. Wild, H. U. Kauczor, W. Schreiber, J. P. Mugler, and E. E. de Lange. 2004. Functional MRI of the lung using hyperpolarized 3-helium gas. J. Magn. Reson. Imaging. 20:540–554. [DOI] [PubMed] [Google Scholar]
- 43.Aguayo, J. B., S. J. Blackband, J. Schoeniger, M. A. Mattingly, and M. Hintermann. 1986. Nuclear magnetic resonance imaging of a single cell. Nature. 322:190–191. [DOI] [PubMed] [Google Scholar]
- 44.Grant, S. C., D. L. Buckley, S. Gibbs, A. G. Webb, and S. J. Blackband. 2001. MR microscopy of multicomponent diffusion in single neurons. Magn. Reson. Med. 46:1107–1112. [DOI] [PubMed] [Google Scholar]


