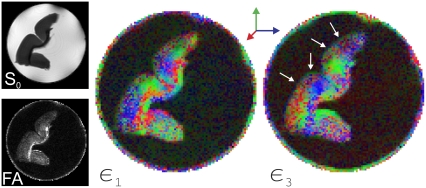
FIGURE 10.
On the left are the non-diffusion-weighted image (S0) and the fractional anisotropy (FA) map computed from the diffusion tensors. The center image shows the orientations of the principal eigenvectors where the rightmost image depicts the orientations of the eigenvector corresponding to the smallest of the three eigenvalues. This map clearly illustrates the directions normal to the cortical surface of the rat brain.

