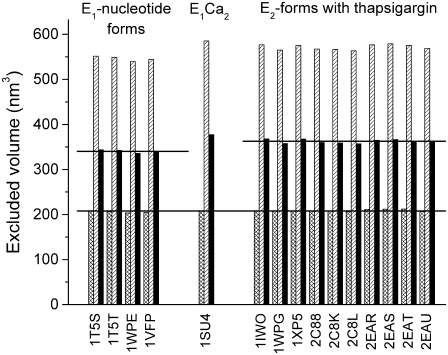
FIGURE 7.
Analysis of hydration differences in Ca-ATPase crystal structures. For 15 Ca-ATPase structures (indicated by their PDB accession codes), the Voidoo software (33) was used to calculate the volume inaccessible to a water molecule (represented by a sphere of 0.18 nm radius; cross-hatched bars) and that inaccessible to a PEG molecule (sphere of 1.1 nm radius; hatched bars). The difference between these volumes is also shown for each Ca-ATPase structure (solid bars), and the average volumes are indicated by horizontal lines.

