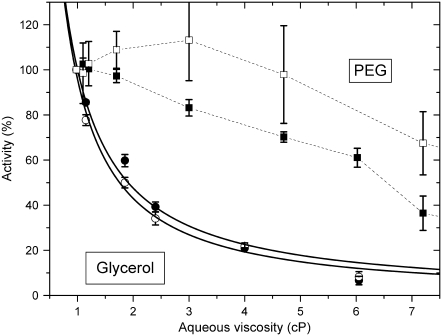
FIGURE 8.
Dependence of Na,K-ATPase (▪,•) and Na-ATPase (□,○) activities on viscosity, ηs, of the suspending glycerol (•,○) or PEG (▪,□) solutions. Solid lines are nonlinear, least-squares fits of a  dependence from Eq. 3 to the glycerol data with ɛ = 1.07 ± 0.11 and 1.16 ± 0.07 for Na,K-ATPase and Na-ATPase, respectively. Dotted lines through the PEG data are only to guide the eye.

