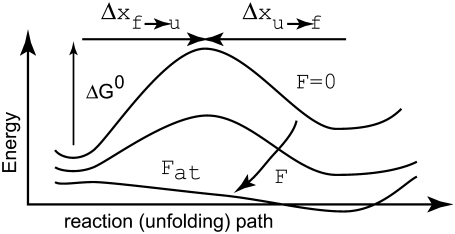
FIGURE 2.
The figure illustrates the energy path along the folded ⇆ unfolded reaction path.  is the activation energy for the process f → u when F = 0. With finite tension, the net activation energy is reduced so that
  where Δxf→u is the activation length, akin to an activation volume for solid-state reactions. The activation length for the refolding transition is Δxu→f; note Δxu→f < 0. When F = Fat, ΔG = 0 and there is an athermal driving of all domains into the unfolded state.

