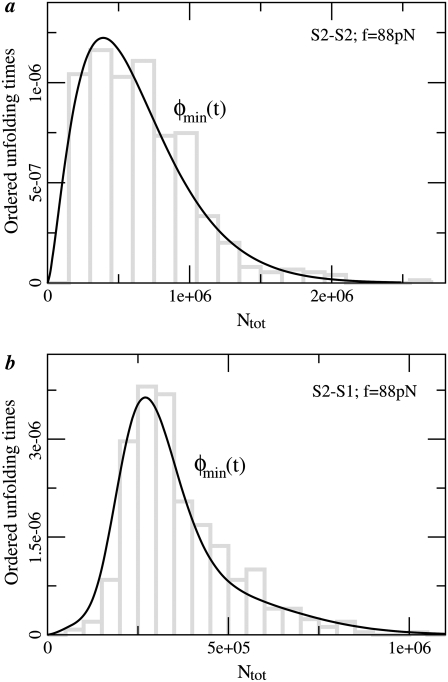
FIGURE 7.
Probability density functions for the first order (min) statistic, t1:2 = tmin, for tandems S2–S2 (a) and S2–S1 (b), obtained at f = 88 pN. The histograms (bars) of tmin are superimposed with the theoretical pdfs, φmin(t) ≡ φ1:2(t) (Eqs. 7 and 8). The parameter values, obtained from the fit, are given in Table 4.

