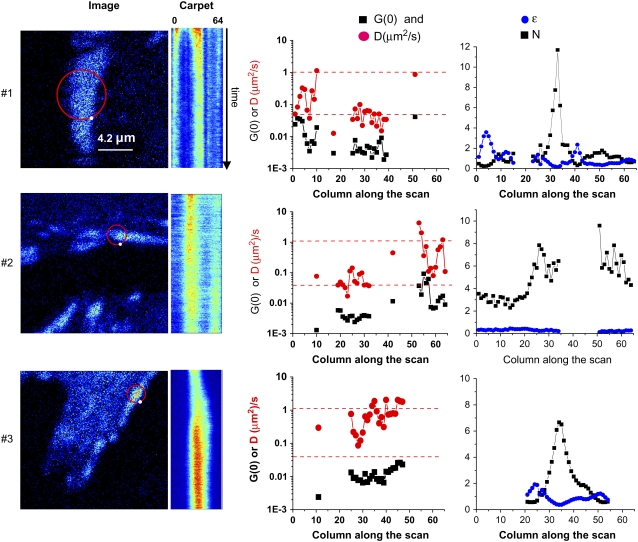
FIGURE 3.
sFCS of paxillin-EGFP in and around an adhesion. Data were sampled at 64 kHz (1 ms/orbit, 64 points/orbit). The circle on the images shows the center position of the laser scanning orbit. The white dot on the orbit path shows the beginning of the orbit. The orbit is scanned clockwise. Intensity carpets are an image generated using the intensity data along each orbit, the x axis, with each successive orbit displayed along the y axis. Plots are also shown for the ACF-extrapolated amplitude (G(0,0), solid squares), the apparent diffusion coefficient in μm2/s (Dapp, red circles), PCH analysis of the molecular brightness in kHz/molecule, (ɛ, blue dots), and the number density (N, solid squares) along the scan orbit. The G(0) and diffusion coefficients were calculated with a one-species fit after detrending. Adhesion 1 (upper) is a relatively stationary adhesion in paxillin null MEFs (pax(−/−)). The region at position 35 corresponds to the bright intensity column in the carpet representation. The total time of this measurement was 240 s. Adhesion 2 (middle) is a growing adhesion in CHO-K1 cells stably expressing paxillin-EGFP. The orbit diameter was 0.85 μm, corresponding to a 0.04-μm pixel size, along the orbit. The total acquisition time for this experiment was 540 s. Adhesion 3 (lower) is a growing adhesion in CHO K1 cells stably expressing paxillin-EGFP. The orbit diameter was 0.85 μm, and the total measurement time was 540 s.

