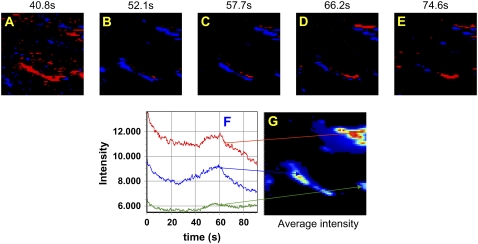
FIGURE 7.
(A–E) Negative (blue) and positive (red) pixel intensity derivatives at selected times; 128 frames were averaged to calculate the derivative at each time point from 41 to 75 s. (F) Intensity versus time traces at different pixel locations within the image time series. The red, blue, and green arrows identify the points in the image (G) corresponding to the intensity traces.

