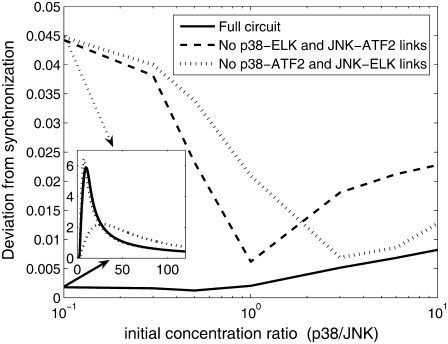
FIGURE 6.
Deviation from synchronization of bifan motif and nonbifan circuits for a range of initial conditions. Deviation from synchronization was calculated as the root mean-square of the difference between normalized concentrations (see text for details). The network is the same as in Fig. 5 and the initial conditions are: [ATF2] = [ELK] = 20 μM, [c-Jun] = 10 μM, [p38] = 3 μM, and [JNK] was varying from 0.3 to 30 μM. As an example, time course of free ATF2* and ELK* is presented in the inset for the case p38:JNK = 1:10. In the full bifan configuration (solid lines) the two lines coincide, whereas without the cross links (dotted line) the two TFs are not synchronized.

