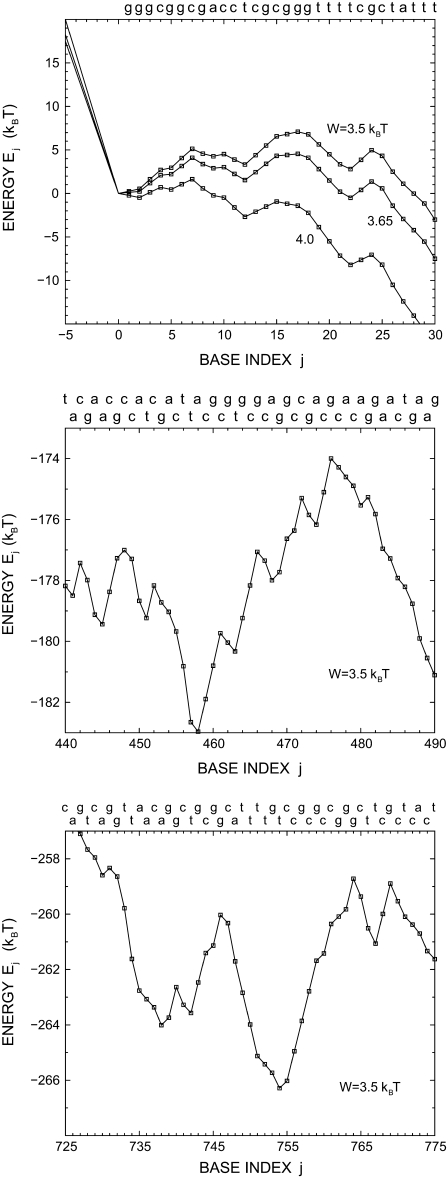
FIGURE 4.
Detailed views on the energy landscapes Ej of a λ-phage DNA duplex in the ranges −5 ≤ j ≤ 30, 440 ≤ j ≤ 490, and 725 ≤ j ≤ 775. For j < 0, the landscapes are simply given by Ej = −Wj. They are smooth and show different slopes according to the three values of W. The corresponding base sequence is given at the top of each figure. T = 20°C.

