
FIGURE 7.

Ratio of average value 〈tu〉 and mean-square deviation Δtu of the unzipping time as a function of the number jmax of basepairs, for different values of W. We have 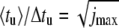 for a sequence-independent energy landscape at W → ∞. This dependence is shown as a dashed line. T = 20°C. The ratio 〈tu〉/Δtu is evaluated over 10,000 individual runs.