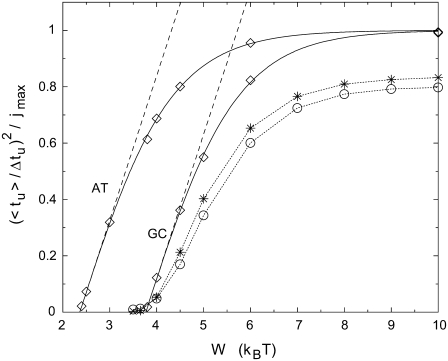
FIGURE 8.
Normalized square of the average/deviation ratio of the unzipping time as a function of bias W. Analytical results for duplexes with homogeneous sequences, a sequence of AT basepairs and a sequence of GC basepairs, are shown as solid lines. Corresponding Monte Carlo results (jmax = 500) are presented as diamonds. The linear regime close to threshold is the validity range of the Einstein relation (linear response regime, where tanh(x)  x). Monte Carlo results for the sequence of the first 500 bp (100 bp) of the λ-phage DNA are represented by stars (circles). Monte Carlo results are computed over 10,000 runs. T = 20°C.

