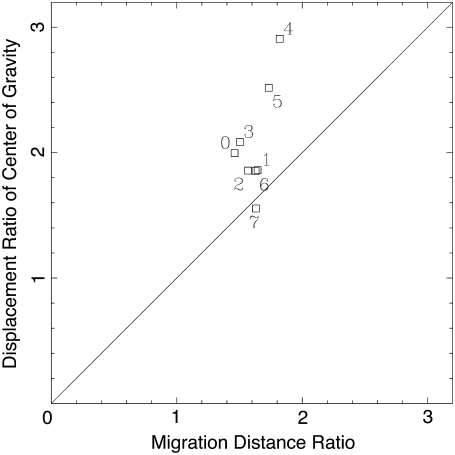
FIGURE 10.
The displacement ratio versus the migration distance ratio of the plasmodium in Fig. 4. Data points are numbered in temporal order. Data point 0 is calculated from the first, second, and third extrema marked by small squares of the projected center of gravity curve in Fig. 7; data point 1 is calculated from the second, third, and fourth extrema; and so on.

