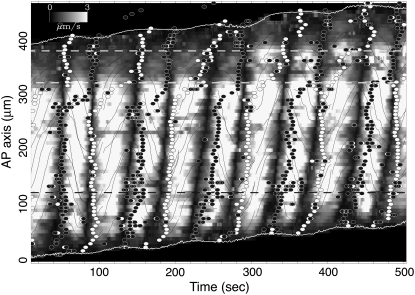
FIGURE 11.
Joint plot of the absolute value of the velocity field (grayscale), points of onset of contractions (open circles) and relaxation (solid circles), orbits of fluid particles obtained by numerically integrating the velocity field (solid curves), and the longitudinal positions of the anterior and posterior ends of the plasmodium (open curves) on the time-longitude plane. The time series of width and velocity of the flow at longitude 120 μm (indicated by the dashed line) is depicted in Fig. 12. Two open dashed lines indicate the corresponding positions of the white dashed lines in Fig. 9.

