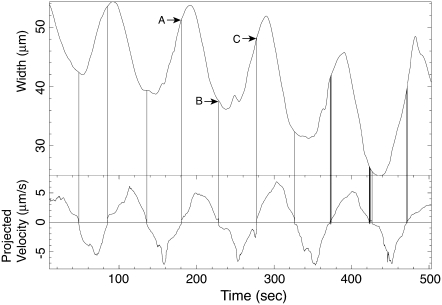
FIGURE 12.
The time series of the width (upper curve) and the maximum flow velocity (lower curve), both at the solid dashed line in Fig. 11. The length of the maximum velocity vector over the latitude line is plotted with sign indicating the direction of the flow. The positive velocity means the forward flow. The mass center of line segment AB (thus the time-average of width in forward flow) is larger than that of BC (the averaged width in backward flow). Due to the delay of the extrema of the width, the width is wider during the forward flow than during the backward flow. Vertical lines indicate the points of reversal of the flow.

