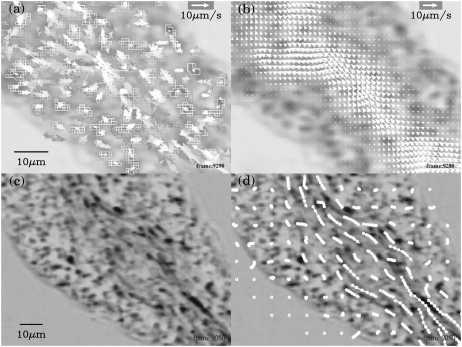
FIGURE 2.
The process of vector field measurement and comparison of trajectories of vesicles and the path line obtained from the measured vector field. All images are captured from processed movies. Panels a and b are at the same frame in the movies as in Fig. 1. Panels c and d are at the same frame. (a) The cluster velocity data in the last 3 s. The older the data, the darker the arrows. (b) The resultant vector field obtained by averaging the data depicted in panel a over time (±90 frames) and space (±3 pixels). (c) The superposition of positive enhanced image over ∼10 s. The older the image, the fainter the spot. The moving vesicles should appear as elongated dark spots like comets. (d) The path lines obtained by numerically integrated the constructed vector field are drawn on panel c. A circle is depicted on the path line every 0.5 s.

