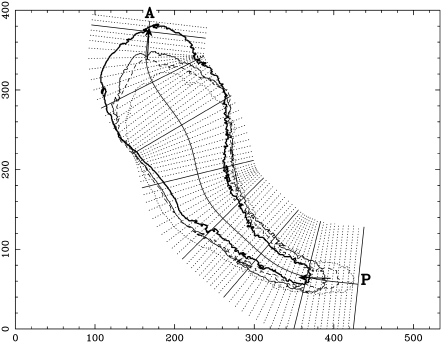
FIGURE 3.
Coordinate system of the plasmodium in Fig. 4. This plasmodium has come from the right and is completing an upward turn. Edge curves are shown at 10 s (thin dotted curve), 150 s (thin broken curve), 290 s (thin solid curve), and 430 s (thick solid curve). The numbers indicate length scale (μm). The curve P to A is the longitude curve. The solid and dotted lines perpendicular to this longitude curve are the latitudinal lines. Arrows are examples of anterior and posterior dipole vectors, which are defined in Appendix B.

