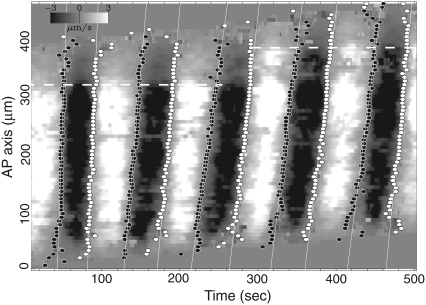
FIGURE 5.
The grayscale plot of the maximum velocity vector of the same plasmodium as in Fig. 4 on the time-AP axis plane. The length of the maximum velocity vector over the latitude line with sign indicating the direction of the flow is plotted. The forward flows are represented by the lighter shade, and the backward flows are represented by the darker shade. The open circles mark the onset of the forward flow, and the solid circles mark the onset of the backward flow. These circles are fitted with lines to obtain the shifting velocity of the vector field. The shifting velocities except first two flows are 12 ± 1μm/s. The absolute value of the averaged velocity of the flow over the channel is 3 ± 0.5μm/s.

