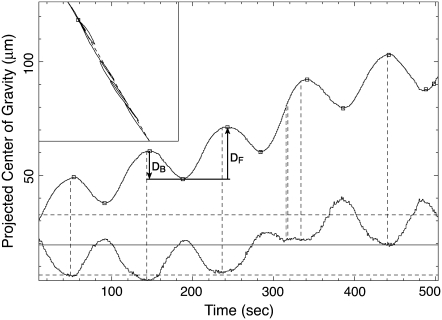
FIGURE 7.
Movement of the center of gravity of the plasmodium in Fig. 4. The inset in the upper left-hand corner is the movement on the original image plane, and a broken line connects the first and last data points. A small square marks the last data point. The upper curve is the projection of the two-dimensional data onto the dotted line of the inset. Small squares mark the extreme points. The bottom curve is the area of the plasmodium in the movie image. The central solid line of this curve is the average. The broken lines above and below the center line represent 105% and 95% of the average value. Vertical broken lines are drawn from the local minimum of this curve to the center of gravity curve. Note the coincidence between the extrema of the two curves.

