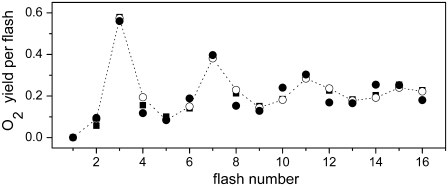
FIGURE 3.
Comparison of theoretical and experimental data of the period-four oxygen oscillation induced by 16 flashes. Initial conditions for simulations are the same as for measured data (24) (Fig. 2). Open circles show experimental data redrawn from Isgandarova et al. (24). Solid squares (different kinetics of the intermediate S-states in the lower and higher S-states) and solid circles (high misses during the S2-S3 transition) show theoretical simulations for S-state dependent kinetics of the intermediate S-states. Model used for simulations is the same as used for simulations of the oscillations presented by solid circles in Fig. 2.

