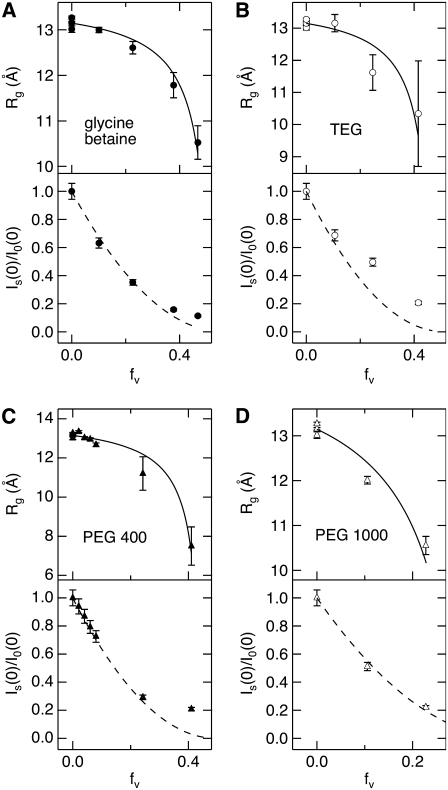
FIGURE 3.
Lysozyme Rg determined by SANS and the zero-angle neutron scattering intensity ratio with and without solute,  both as a function of solute volume fraction, fv, for (A) glycine betaine, (B) TEG, (C) PEG of molecular weight 400, and (D) PEG 1000. Solid lines are fits made to Rg with a composite model (Eqs. 3 and 4) to calculate the amount of protein-associated water, Nw, and dashed lines show the expected intensity ratio dependence on fv based on the Rg fits.

