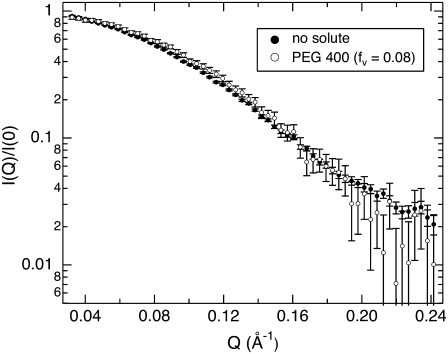
FIGURE 5.
SANS profiles for GK at 5 mg/mL in D2O with no solute and in the presence of 8% PEG 400. For comparison, the SANS intensity is normalized by the scattering at zero angle, I(Q)/I(0). The protein appears smaller with added solute; Guinier fits to these curves yield Rg = 17.0 ± 0.1 Å and 16.0 ± 0.2 Å for no solute and 8% PEG 400, respectively.

