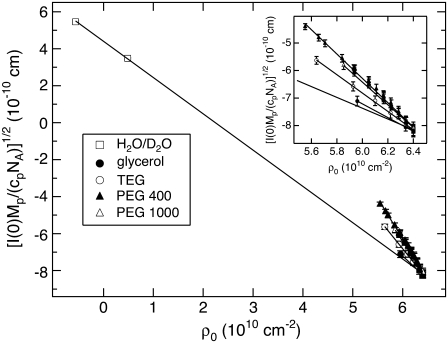
FIGURE 6.
Contrast variation for GK by H2O/D2O and solute/D2O. Plotted is the square root of the zero-angle scattering intensity,  versus bulk solution scattering-length density, ρ0. (Inset) Detailed view of the solute/D2O contrast variation region. The different slopes from the H2O/D2O contrast variation line with added solutes are attributed to protein-associated water.

